

The Nasdaq index is experiencing increasing selling pressure after breaking below the lower boundary of the bullish channel, indicating the conclusion of an upward trend that has persisted over recent sessions. The intense sell-off has triggered the formation of new lows on the chart, illustrating that sellers are beginning to regain control over the market direction. This shift also reflects escalating concerns regarding the growth outlook of the technology sector, which has long been the primary driver for the Nasdaq.
From a technical standpoint, the trend reversal is clearly visible after the Moving Average (MA) begins a sharp decline, confirming the loss of short-term bullish momentum. Meanwhile, the ZigZag indicator shows a continuous downward pattern, emphasizing that selling pressure remains active in the market. The combination of these two signals suggests that the correction phase is likely not over yet, especially if prices fail to break back above the area that has transitioned from support to resistance.
Recommended

Recommended

Recommended

Recommended
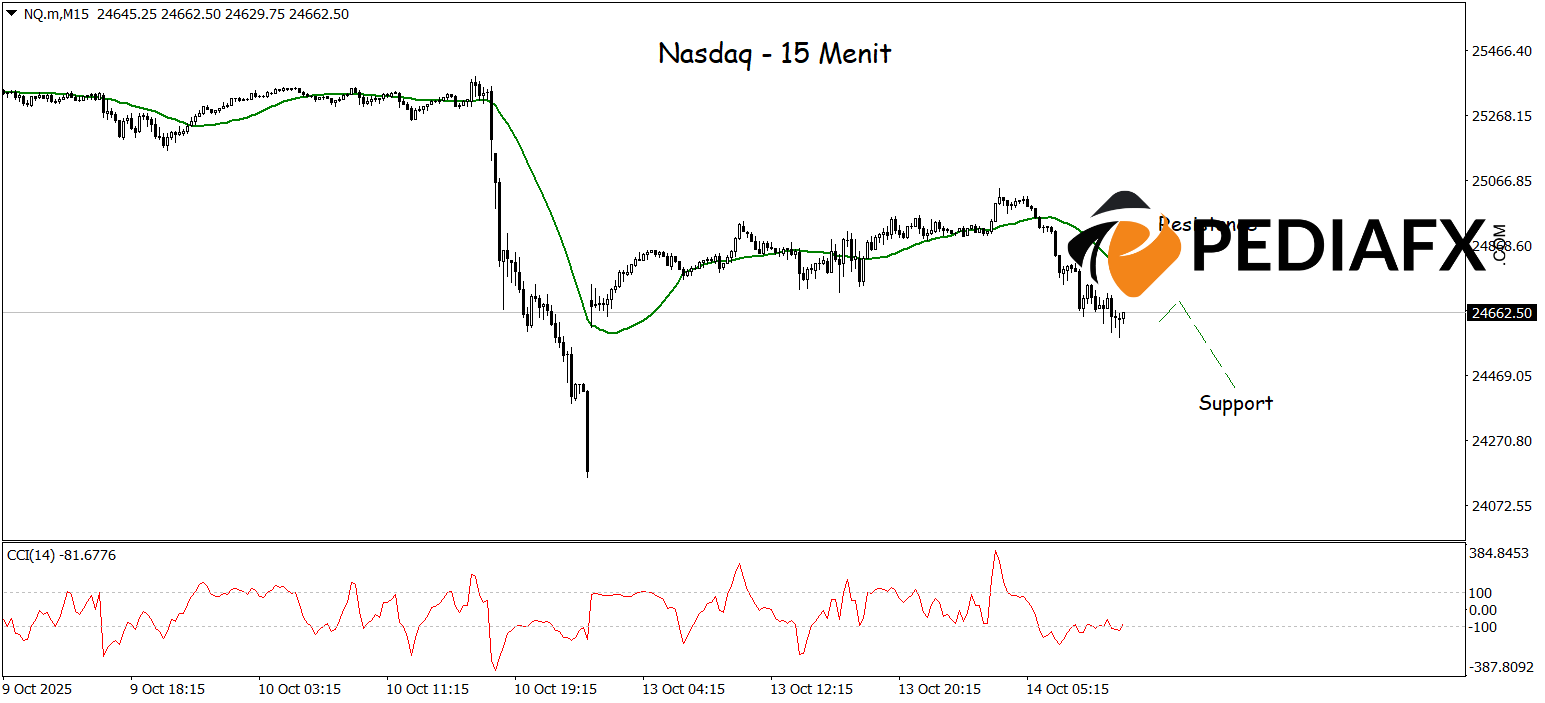
On the 15-minute chart, the CCI indicator’s descent from the overbought territory further reinforces the potential for continued weakening. As long as selling pressure dominates and prices remain below the main MA line, the Nasdaq may deepen its decline towards support around 24,717 before attempting to establish a stable base for the next rebound. However, if buyers start to respond in that zone, there could be a short-term opportunity for a technical correction upward.
Technical Reference: Sell below 24,910
Potential Take Profit 1: 24,820
Potential Take Profit 2: 24,910
Potential Stop Loss 1: 24,513
Potential Stop Loss 2: 24,427


