

The Nasdaq is showing signs of potential short-term correction after it failed to create a higher resistance level on the one-hour chart. This failure suggests a weakening in buyer momentum, while a declining ZigZag pattern is affirming a shift towards bearish sentiment. This situation acts as an early warning that the market may be losing its drive for further gains.
From a technical perspective, the Moving Average (MA) is currently positioned above the running price, reinforcing the indication of increasing selling pressure. As long as the price cannot break back above the previous resistance zone, the possibility of a downward correction in Nasdaq remains open. This scenario signals that sellers could take control in the short term, with the target of testing the nearest support level as part of the correction phase.
Recommended

Recommended

Recommended

Recommended
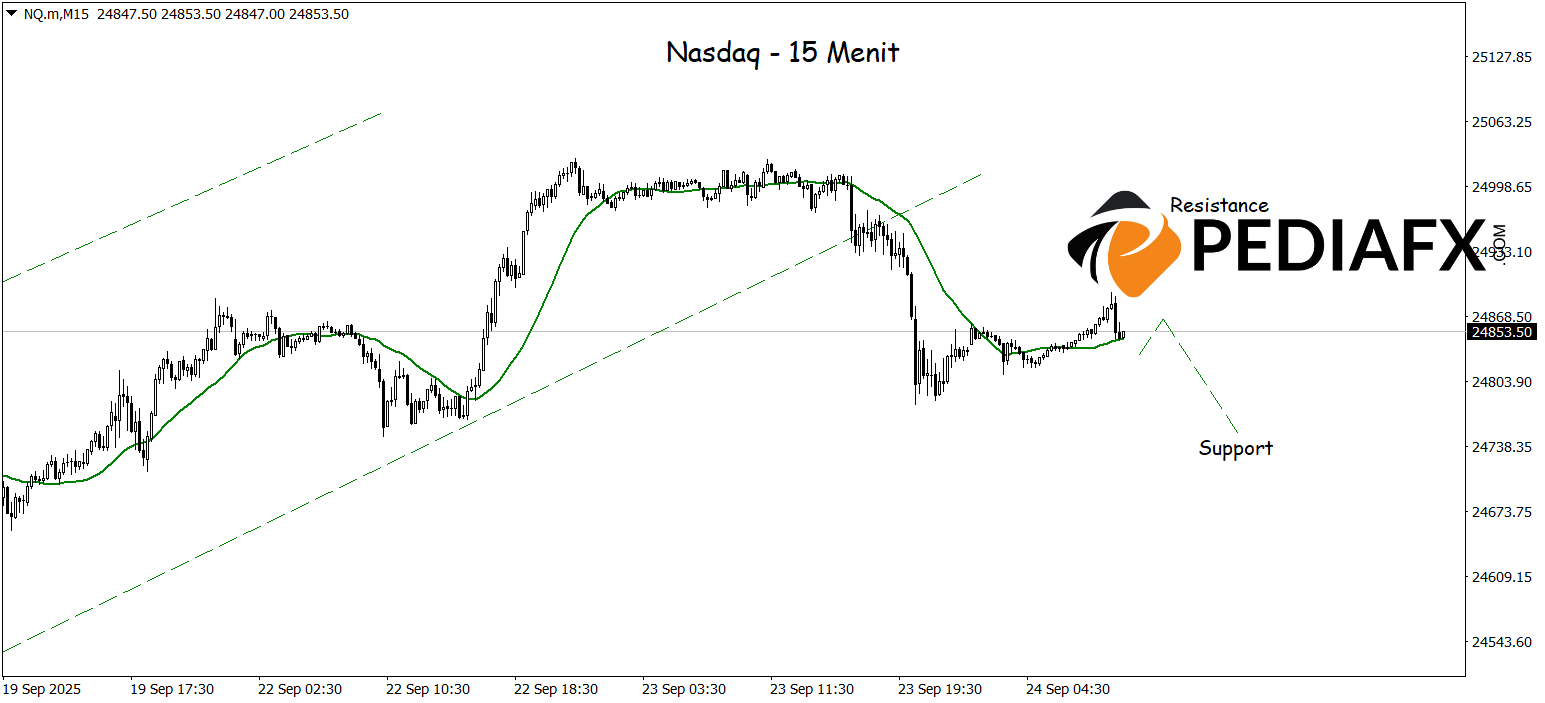
The Nasdaq’s 15-minute chart demonstrates signs of weakening after the bullish channel was successfully breached downwards (breaklow), marking an initial indication of a potential bullish to bearish direction reversal. The downward pressure is becoming stronger with the Moving Average (MA) likely to decrease, further emphasizing the chances of a price correction. In this scenario, the Nasdaq may continue to decline to test a significant support area around 24,748.
Technical Reference: sell while below 24,967
Potential Stop Loss 1: 24,926
Potential Stop Loss 2: 24,967
Potential Take Profit 1: 24,787
Potential Take Profit 2: 24,748


