

The Nasdaq is showing signs of technical weakness after failing to establish a new Higher High (HH) on the 1-hour timeframe. Instead of continuing its upward trend, the Nasdaq has breached the previous low, suggesting that the bullish momentum is beginning to falter. This situation is further reinforced by the position of the Moving Average (MA), which has now positioned itself above the current price, acting as a dynamic resistance that curtails any attempts at a rebound.
Moreover, the ZigZag indicator is starting to exhibit a downward tendency, creating a price structure that is lower than previous levels. The combination of these technical signals indicates that the Nasdaq may continue to weaken in the short term. Should the selling pressure persist, the index is likely to test the low of the prior bullish channel, which currently serves as a critical support level for the continuation of the medium-term trend.
Recommended

Recommended

Recommended

Recommended
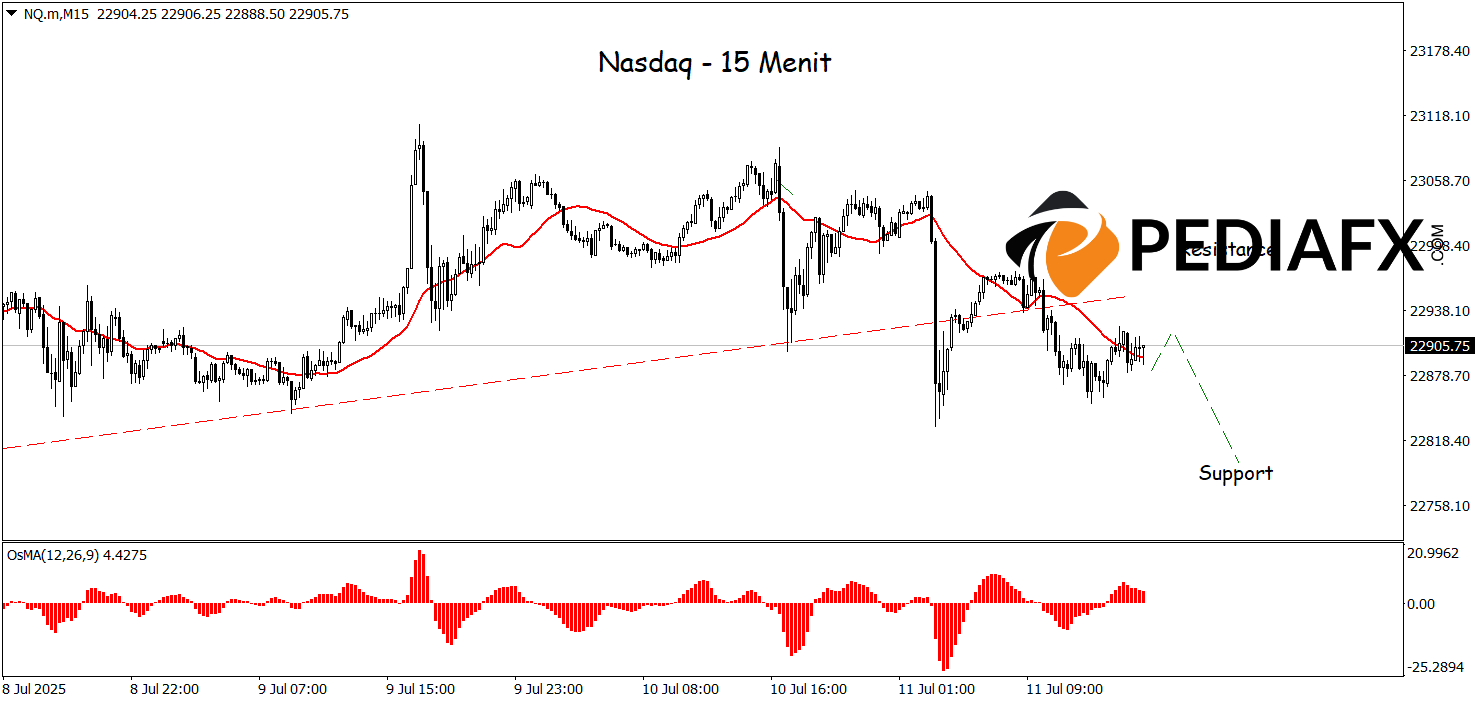
The Nasdaq is beginning to exhibit signs of weakness after breaching the bullish trendline to the downside, indicating a potential reversal of the trend in the near term. This downward pressure is further intensified by the declining direction of the Moving Average (MA) and the OsMA indicator, which is positioned in negative territory, signaling that buying momentum continues to weaken. With this technical confirmation, the Nasdaq has the potential to resume its correction and test the crucial support area around 22,795.
Technical Reference: sell while below 22,985
Potential Stop Loss 1: 22,945
Potential Stop Loss 2: 22,985
Potential Take Profit 1: 22,830
Potential Take Profit 2: 22,795


