

The Nasdaq has recently experienced increased selling pressure after hitting a resistance area within a bullish channel, indicating the upward momentum may be fading. This decline is further corroborated by the Zigzag indicator, which has also turned downward, signaling a potential formation of a lower high on the one-hour chart. This signal suggests that short-term bearish movements remain likely, particularly if the selling pressure persists throughout the European trading session. Profit-taking around the resistance area is also contributing to the strain on this technology index.
On the technical front, the Moving Average (MA) is now tilting downward, and the CCI has moved out of the overbought zone, reinforcing the confirmation of weakness. The combination of these signals reflects a shift in market sentiment towards a more cautious approach, as traders are wary of a deeper correction. If the selling pressure continues, the Nasdaq may test the nearest support area in the short term. However, as long as prices stay below the resistance line of the channel, the movement bias is expected to remain on the negative side during the European session.
Recommended

Recommended

Recommended

Recommended
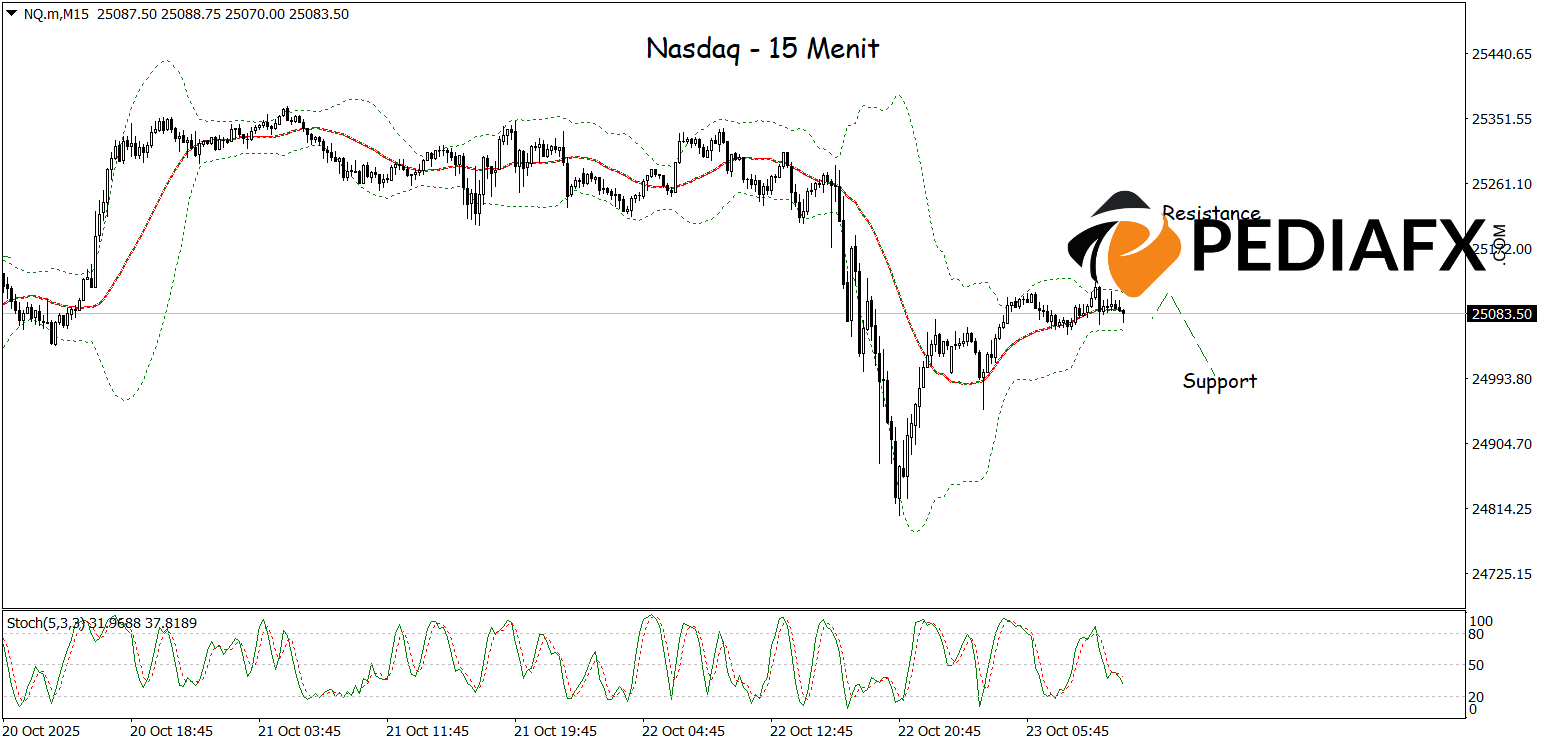
The Nasdaq appears to be losing its upward momentum after declining from the Bollinger Bands (BB) resistance area and recently breaching the middle band, signaling the potential for further weakness. The Stochastic condition, currently in the overbought zone, further reinforces the potential for short-term selling pressure, indicating the market may face a technical correction. Given this set of indicators, the Nasdaq may continue to decline during the European session and is gearing up to test the significant support level at 25,000 as its next target.
Technical Reference: Sell below 25,202
Potential Take Profit 1: 25,160
Potential Take Profit 2: 25,200
Potential Stop Loss 1: 24,043
Potential Stop Loss 2: 25,000


