


The Nasdaq index is exhibiting signs of short-term weakness after the price was rejected from the upper Bollinger Bands on the intraday timeframe. This rejection suggests the emergence of selling pressure as the price attempts to breach the upper limit of volatility but fails to sustain bullish momentum. The price structure is starting to display a downward tendency, while the Moving Average indicators are flattening out, indicating a possible directional shift or consolidation before further movement.
Support for the bearish scenario is bolstered by the MACD indicator, which remains in negative territory, with the MACD line positioned below the signal line. This reinforces the notion that bearish pressure has not dissipated, leading market participants to exercise caution against further declines.

Recommended

Recommended

Recommended

Recommended
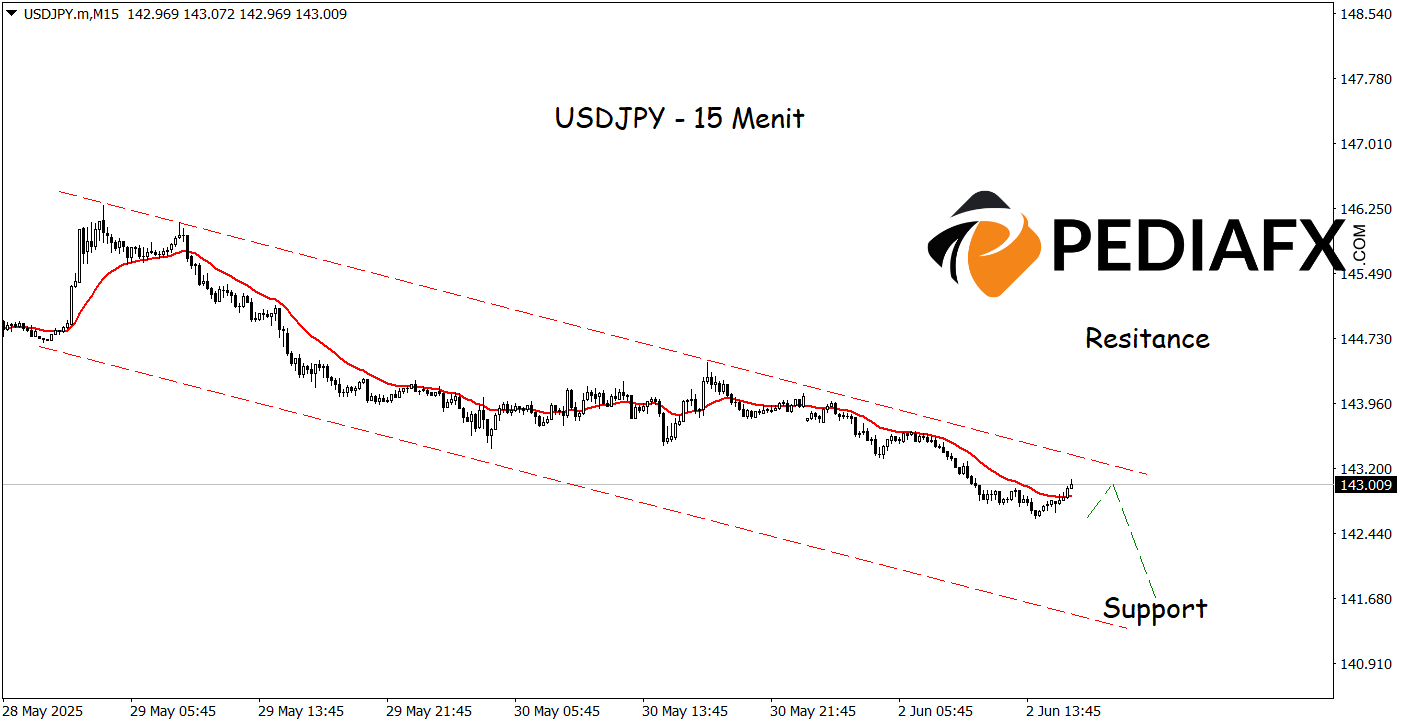
The Nasdaq is poised for short-term weakening as the Moving Average (MA) line on the 15-minute timeframe begins to flatten and trends downward, reflecting a waning upward momentum. The selling pressure is further validated by the Commodity Channel Index (CCI), which sharply declined from the overbought territory, signaling a shift in market sentiment from bullish to bearish. This combination of technical signals indicates that the Nasdaq is at risk of continuing its decline towards the level of 21,130.
Technical Reference: sell while below 21,555
Potential Stop Loss 1: 21,505
Potential Stop Loss 2: 21.555
Potential Take Profit 1: 21,195
Potential Take Profit 2: 21,130








