

The Nasdaq index is starting to display signs of weakening after breaching the lower edge of a bullish channel on the 1-hour chart, indicating a potential shift from a bullish to a bearish trend. Selling pressure is becoming increasingly dominant as the Moving Average (MA) trends downward, underscoring the fading strength of buyers. The ZigZag pattern also reveals a consistent downward series, confirming that previous upward momentum is beginning to lose its drive.
Under these technical conditions, the likelihood for a correction in the Nasdaq is quite significant. If selling pressure continues, the index may proceed to weaken further, potentially testing the nearest support level as a critical testing ground. Conversely, should the price manage to stay above the key support, a rebound remains a possibility as a retest before a fully confirmed bearish trend. This establishes important technical levels as primary reference points in assessing the short-term movement of the Nasdaq.
Recommended

Recommended

Recommended

Recommended
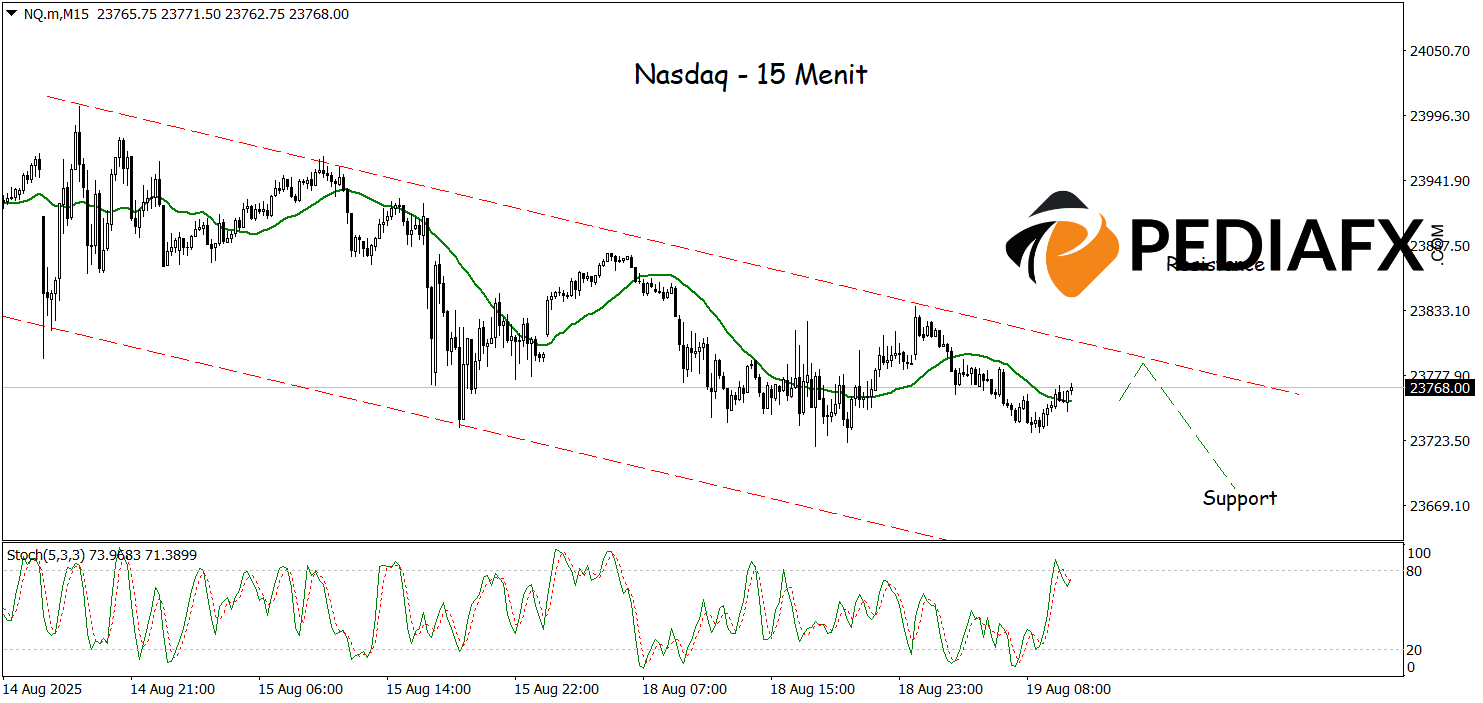
The Nasdaq continues to move within a bearish channel on the 15-minute chart, with the MA trending down and Stochastic in the overbought area, indicating that the seller dominance is growing stronger. This technical situation opens up further possibilities for weakness, with the nearest target likely to test the lower area around 23,682 as a crucial support level, which will determine if the correction continues or if the market enters a short-term consolidation phase.
Technical Reference: sell while below 23,860
Potential Stop Loss 1: 23,827
Potential Stop Loss 2: 23,862
Potential Take Profit 1: 23,718
Potential Take Profit 2: 23,682


