

The Nasdaq index displays signs of continued weakness after prices have breached the lower boundary of the bullish channel that previously supported upward movement. This break indicates that further declines remain highly possible, especially after a pullback that formed a Support Become Resistance (SBR) pattern. The rejection of prices from the SBR area adds further confirmation that selling pressure is once again dominating the market, strengthening the potential for a continued bearish trend in the upcoming trading sessions.
From a technical perspective, the downward direction of the Moving Average (MA) and a zigzag pattern consistently creating lower lows further emphasize the dominance of sellers in the market. This condition suggests that the bearish momentum remains sufficiently strong to drive prices lower on the 1-hour chart. As long as the Nasdaq fails to break back above the SBR area, selling pressure is expected to persist, with the potential of testing important support levels ahead.
Recommended

Recommended

Recommended

Recommended
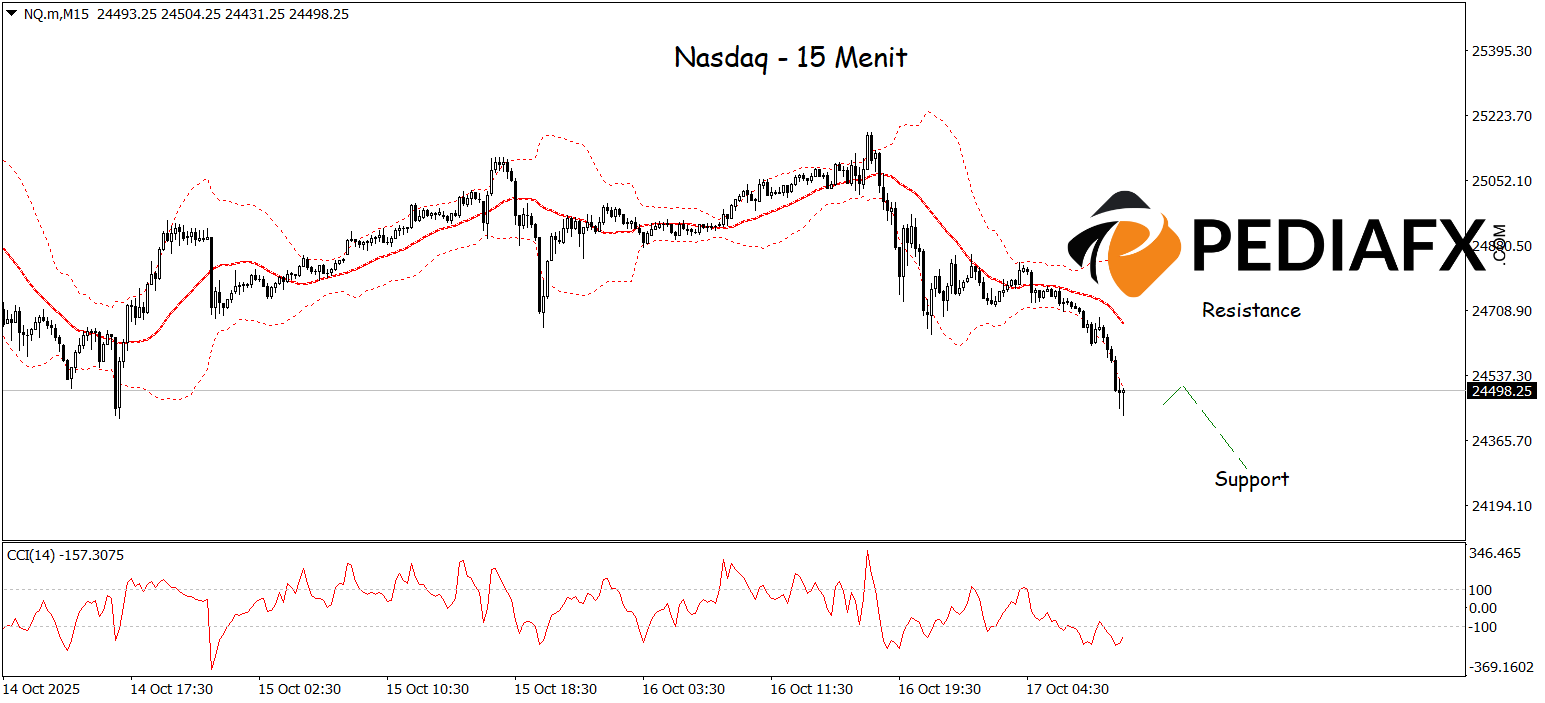
The Nasdaq exhibits potential weakness as prices fail to maintain levels within the resistance of the Bollinger Bands (BB) and begin to trend downward. Selling pressure intensifies alongside the CCI indicator declining from overbought territory, indicating a weakening of upward momentum and an increasing dominance of sellers. Given the current technical conditions, the Nasdaq is likely to continue its descent to test significant support levels around 24,290 in the near term.
Technical Reference: Sell below 24,695
Potential Take Profit 1: 24,618
Potential Take Profit 2: 24,695
Potential Stop Loss 1: 24,350
Potential Stop Loss 2: 24,290


