

Even though the primary trend of the Nasdaq on the 1-hour chart still leans bullish, signs of a correction are becoming increasingly evident as we approach the US session tonight. Following a robust period of gains, the index is starting to lose its steam, forming a minor bearish channel indicated by descending diagonal lines on the price chart. This pattern signals short-term selling pressure, suggesting that some market participants are beginning to take profits. This condition serves as an early warning that Nasdaq’s movement may be entering a phase of consolidation or mild correction amidst the still positive main trend.
From a technical perspective, the flattening of the Moving Average (MA) and the formation of lower highs, as indicated by the ZigZag indicator, further emphasize the slowing momentum of the upward movement. Additionally, the decline of the Commodity Channel Index (CCI) from overbought territory adds to the likelihood of a forthcoming correction. This combination of signals reveals that the potential for a temporary downturn is quite open, before buyers can regain control to continue the main upward trend.
Recommended

Recommended

Recommended

Recommended
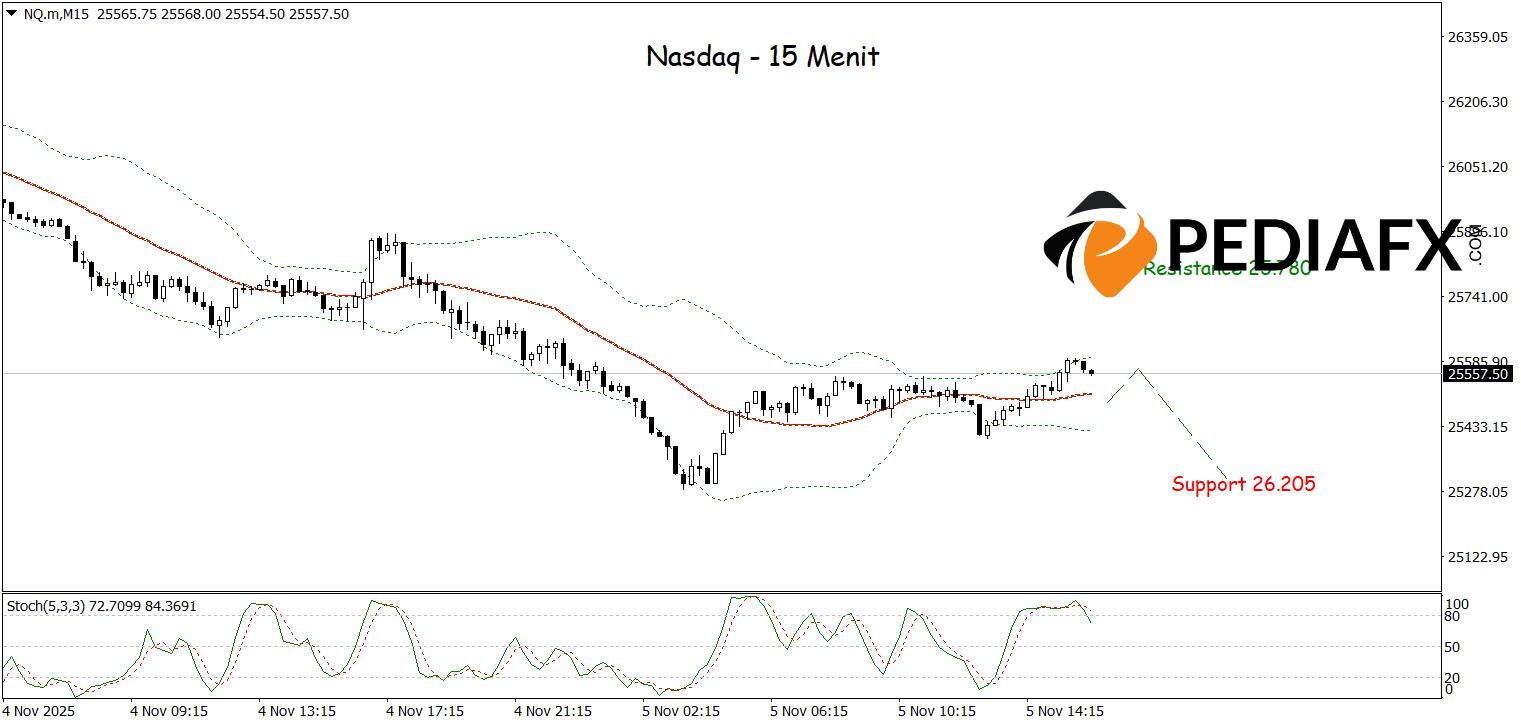
Sell pressure has become more pronounced following the price breaching the lower Bollinger Bands (BB), indicating that bearish momentum is developing as we enter the US session tonight. The downward direction of the MA and the establishment of the bearish trendline further strengthen the short-term negative bias. As long as the price fails to retest the minor resistance area, Nasdaq is expected to continue its decline and potentially test the support level around 25,306 before any chance of a subsequent technical rebound emerges.
Technical Reference: buy as long as it stays above 25,782
Potential Take Profit 1: 25,395
Potential Take Profit 2: 25,306
Potential Stop Loss 1: 25,695
Potential Stop Loss 2: 25,782


