

While the primary trend of the Nasdaq on the hourly chart continues to exhibit a bullish outlook, signs of a correction are becoming increasingly evident as the U.S. session approaches. Following a robust rally, the index is beginning to lose momentum, establishing a minor bearish channel which can be observed through a descending diagonal line on the price chart. This pattern indicates short-term selling pressure, where some market participants seem to be initiating profit-taking actions. This situation serves as an early indication that the Nasdaq’s movement is entering a phase of consolidation or mild correction, against a backdrop of an overall positive trend.
From a technical perspective, the sloping movement of the Moving Average (MA) and the lower highs indicated by the ZigZag indicator reinforce signs of a deceleration in upward momentum. Moreover, the decline of the Commodity Channel Index (CCI) from the overbought territory adds to the likelihood of a near-term correction. The combination of these signals suggests that there is a considerable potential for temporary weakening before buyers regain control to continue the main upward trajectory.
Recommended

Recommended

Recommended

Recommended
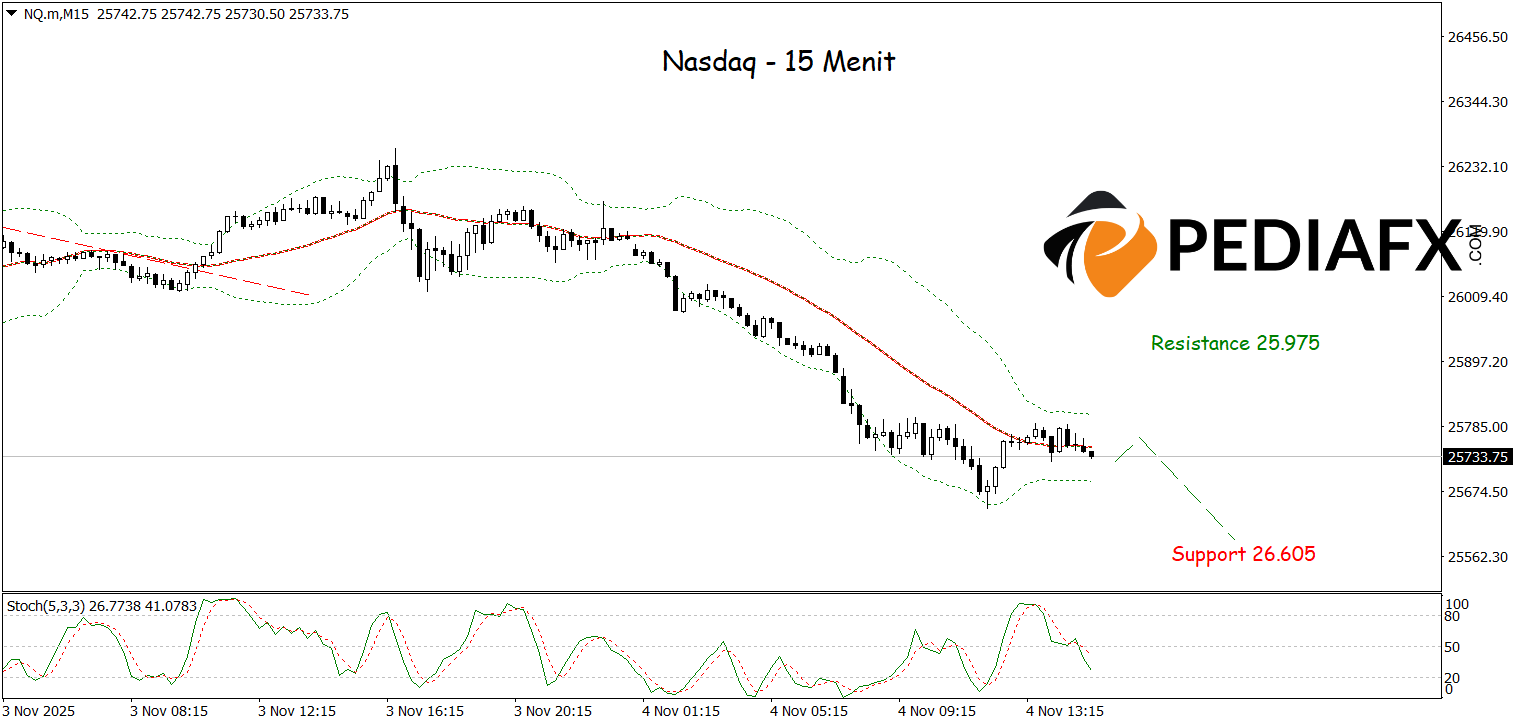
Selling pressure has become more pronounced after prices pierced the lower boundary of the Bollinger Bands (BB), indicating that a bearish momentum is developing in the U.S. session tonight. The decreasing direction of the MA and the establishment of a bearish trendline further solidify the negative bias in the short term. As long as prices cannot break back above the minor resistance area, the Nasdaq is expected to continue its decline and may test the support level around 25,585 before a subsequent technical rebound opportunity arises.
Technical Reference: buy above 25,902
Potential Take Profit 1: 25,837
Potential Take Profit 2: 25,902
Potential Stop Loss 1: 25,640
Potential Stop Loss 2: 25,585


