

A break below the bullish support channel is a significant indicator that the upward momentum of the Nasdaq is starting to fade. After maintaining a stable progression within a consistent bullish pattern, this breach beneath the support reflects a weakening in the strength of the bidders. This situation illustrates that the upward trend may not be as robust as before, and short-term market sentiment is beginning to shift from optimistic to more cautious, particularly as selling pressure rises with each attempt at a rebound.
Technical support has also changed direction. The moving averages (MA) have begun to decline once more, and the MACD is remaining within the negative territory, indicating a notable decrease in buying pressure while seller momentum is on the rise. These two indicators pave the way for the Nasdaq to experience further declines and test the nearest low levels on the hourly chart. If the price continues to hover below the area that was once support for the bullish channel, bearish pressure could escalate further.
Recommended

Recommended

Recommended

Recommended
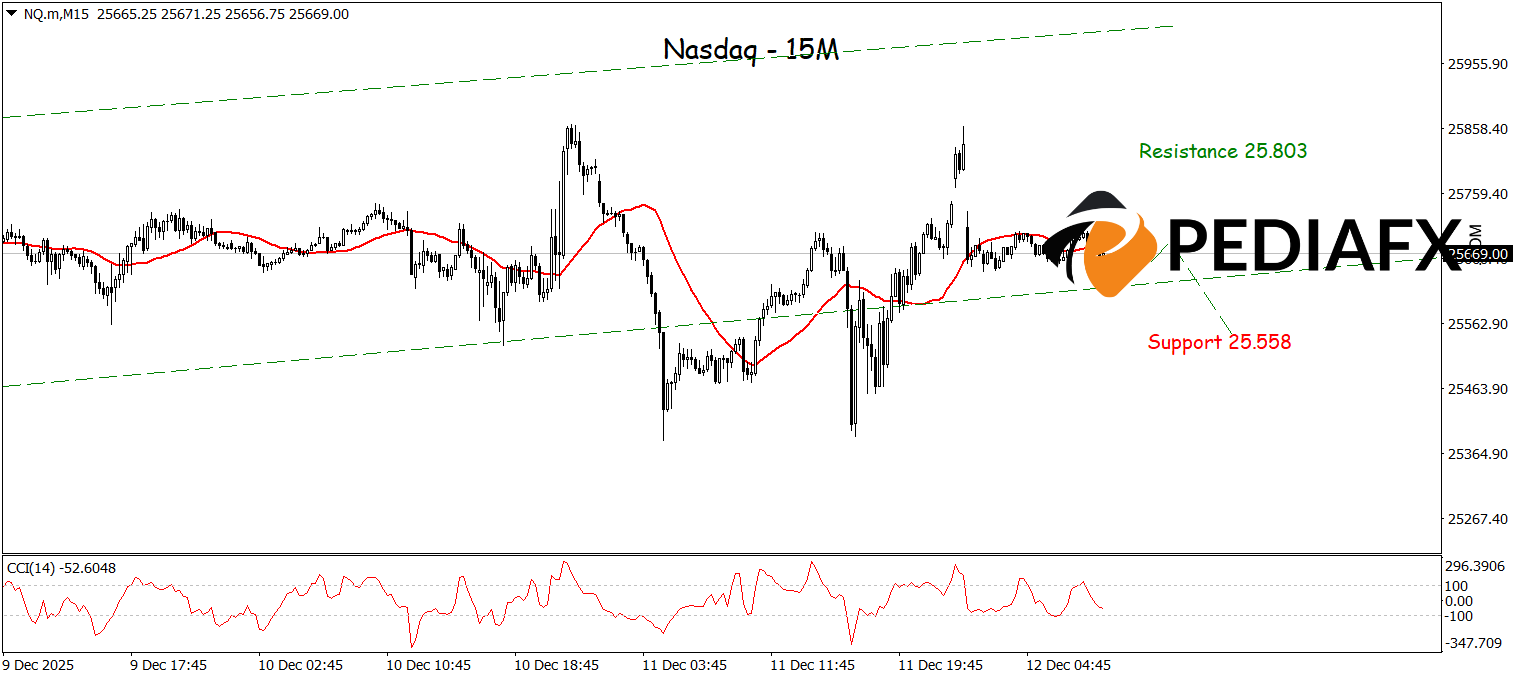
Additionally, the CCI being in the overbought territory reinforces the potential for downward pressure. The break below the previous bullish channel which served as support for the upward structure has resulted in bidders losing their footing, giving an advantage to the sellers in intraday movements. With this blend of technical signals, the Nasdaq is poised to continue its descent and may test the critical support around 25,558, as long as the price fails to rise back above the breached bullish channel threshold.
Technical Reference: sell below 25,803
Potential Stop Loss 1: 25,755
Potential Stop Loss 2: 25,803
Potential Take Profit 1: 25,598
Potential Take Profit 2: 25,558


