

The GBPUSD pair is showing signs of a potential recovery after the price has been restricted at the lower edge of the Bollinger Bands, a zone often regarded as a dynamic support level. This situation is further validated by the Stochastic indicator, which is currently in the oversold territory, suggesting that selling pressure is beginning to fade. This pattern indicates that there’s a possibility for GBPUSD to rebound and continue on an upward trend.
On the one-hour timeframe, the GBPUSD remains within a narrow range around the support zone. Technical indicators show positive signals, as the Bollinger Bands are starting to narrow, indicating a potential upcoming breakout. Moreover, the Stochastic rising from the oversold level provides additional confirmation that bullish momentum could regain dominance.
Recommended

Recommended

Recommended

Recommended
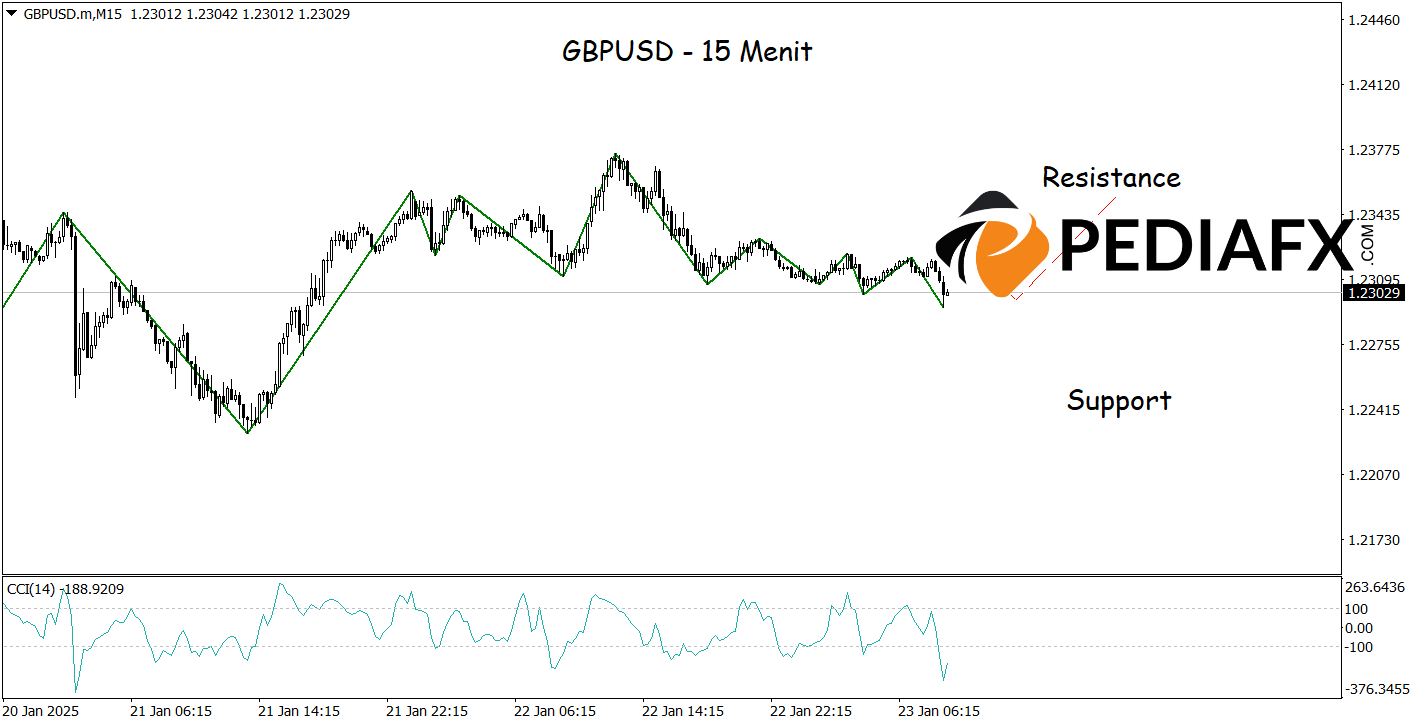
In the 15-minute chart, GBPUSD reveals a solid opportunity for upward movement as prices remain in a bullish trend. The Commodity Channel Index (CCI), having just rebounded from an oversold condition, further bolsters the potential strengthening signal. Following the outlined scenario, GBPUSD might target the resistance level of 1.23540.
Technical Reference: buy as long as it stays above 1.22525
Potential Take Profit 1: 1.23360
Potential Take Profit 2: 1.23540
Potential Stop Loss 1: 1.22710
Potential Stop Loss 2: 1.22525


