

The price of Gold continues to demonstrate a robust bullish movement, having successfully broken through a key resistance zone and exited a bearish channel on the hourly chart. This breakout serves as a strong indicator that selling pressure is beginning to subside, allowing buyers to regain control of the market. The current price structure, which is forming a pattern of higher highs, further confirms that an upward momentum is being established consistently. With the Moving Average (MA) trending upwards, the short-term outlook for Gold appears increasingly stable in a positive trajectory, presenting the possibility of further rallies until the evening.
Recommended

Recommended

Recommended

Recommended
Moreover, the Zigzag indicator has successfully surpassed the last resistance, adding further confirmation that the bullish momentum is developing effectively. As long as prices remain above the breakout area and do not dip below the MA, the potential for an upward move towards the nearest resistance remains very much alive. The support from a combination of technical signals, such as the rising MA, bullish Zigzag, and the breakout from the bearish channel, reinforces the expectation that Gold will continue its positive movement in the near term, aiming to test the next resistance level.
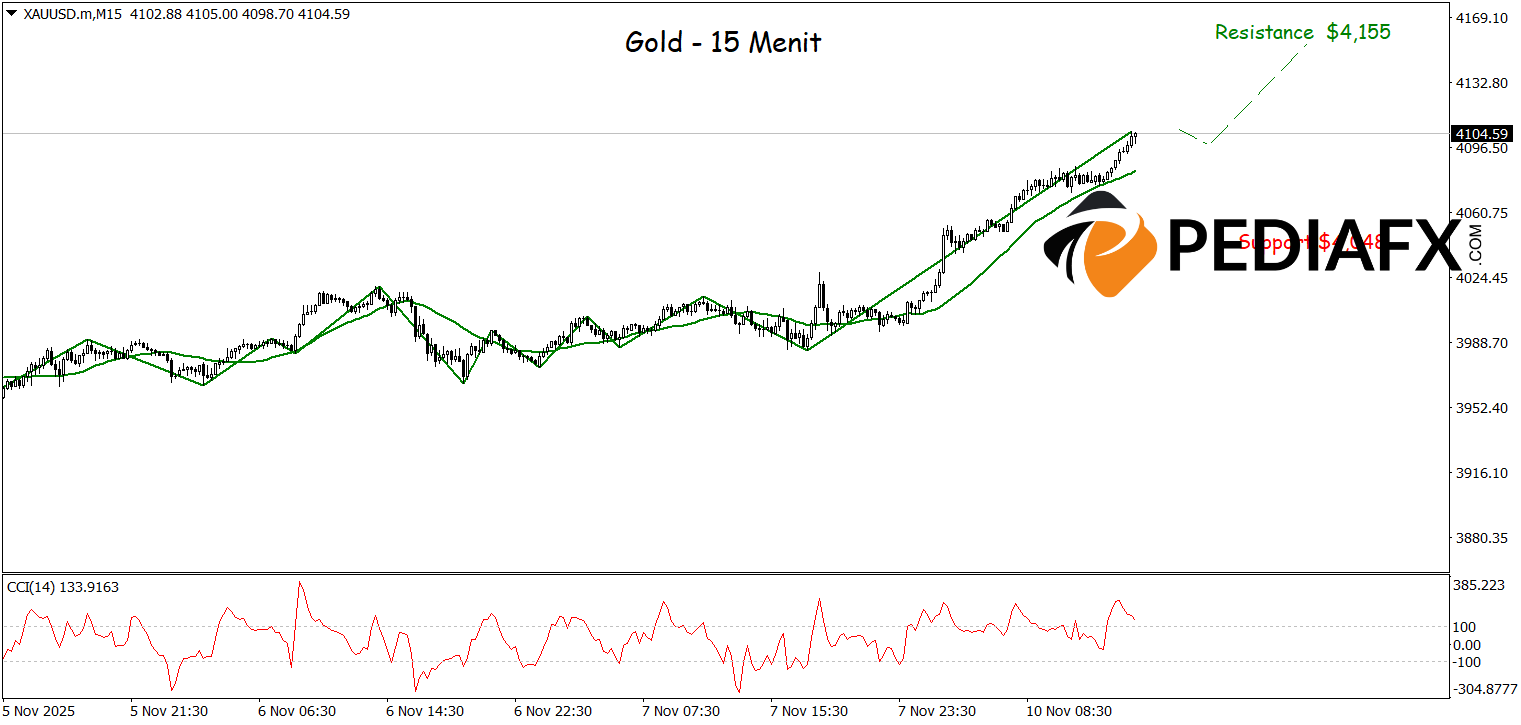
The Zigzag pattern indicates a bullish trend, and with the Moving Average (MA) now positioned below the running price, it reflects an average price increase on the 15-minute time frame. This condition signifies the strengthening buying momentum that is beginning to accumulate, indicating that selling pressure is diminishing and buyers are taking charge of the market. Supported by these technical signals, Gold is set to continue its ascent and test the crucial resistance area at the level of 4,155 as the closest target.
Technical Reference: buy while above 4,048
Potential Take Profit 1: 4,134
Potential Take Profit 2: 4,155
Potential Stop Loss 1: 4,067
Potential Stop Loss 2: 4,048


