

The price of gold continues to display a positive trend, maintaining stability within a bullish channel. The Higher High – Higher Low (HH–HL) price structure on the 1-hour timeframe further strengthens the prevailing upward trend. The ZigZag indicator, which has recently established a new low, emphasizes that buying pressure is still dominant, signaling that the market is comfortable maintaining a bullish bias. Additionally, the Moving Average (MA) line is beginning to flatten with an upward tendency, reflecting the potential for a stronger upward momentum in the short term.
Moreover, the Commodity Channel Index (CCI) is currently in the oversold territory, increasing the likelihood of a technical rebound. This combination of a solid bullish structure, strengthening MA, and an oversold signal on the CCI creates a robust foundation for gold to retest the nearest resistance level. If market sentiment remains supportive, further strengthening opportunities may arise, particularly if the price can break through these key levels and maintain its position above.
Recommended

Recommended

Recommended

Recommended
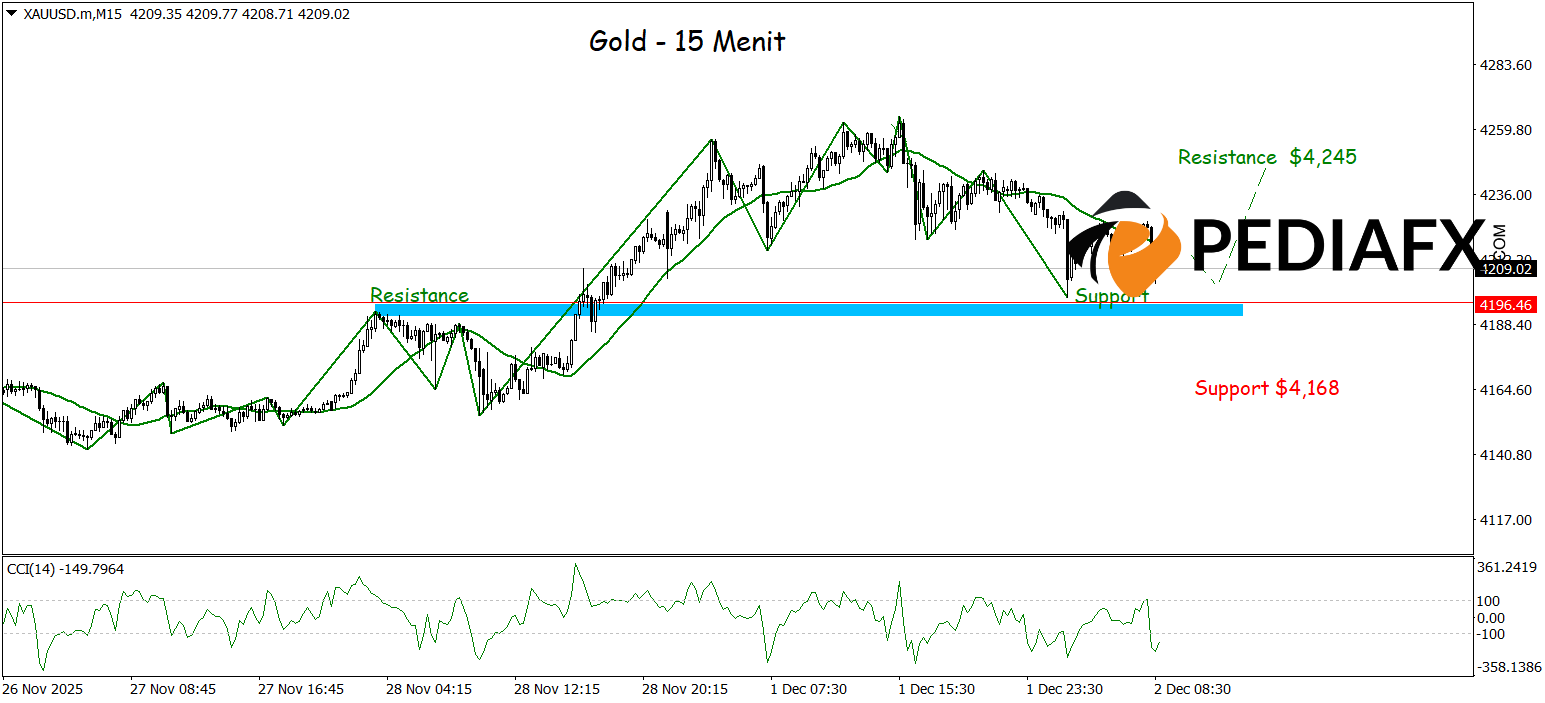
Gold has the potential to continue its rise on the 15-minute chart, especially following the formation of an RBS (Resistance Becomes Support) pattern that provides a technical foundation for prices to move upward again. Additional signals come from the CCI indicator, which is currently in the oversold condition, indicating the possibility of a rebound and increasing short-term buying pressure. With this combination of technical factors, gold is poised to test the resistance level at $4,245, particularly if the price structure can maintain itself above the new support level while upward momentum continues.
Technical Reference: buy while above 4,168
Potential Take Profit 1: 4,232
Potential Take Profit 2: 4,245
Potential Stop Loss 1: 4,180
Potential Stop Loss 2: 4,168


