

Gold has once again failed to break through a significant resistance level on the 1-hour time frame, indicating a lack of buying momentum necessary for continued gains. The price structure now shows a clearer pattern of lower highs (LH) and lower lows (LL), underscoring the short-term dominance of sellers. This movement is further validated by the ZigZag indicator, which has formed a descending pattern, with both highs and lows consistently declining, reflecting sustained selling pressure in the market.
Additionally, the downward direction of the Moving Average (MA) line and negative MACD conditions enhance the current bearish outlook for Gold. These combined technical factors suggest that the selling momentum may still persist, particularly if prices fail to reclaim the nearest resistance area. In this scenario, market participants are advised to remain cautious of potential limited corrections before the downward trend continues toward the next support level.
Recommended

Recommended

Recommended

Recommended
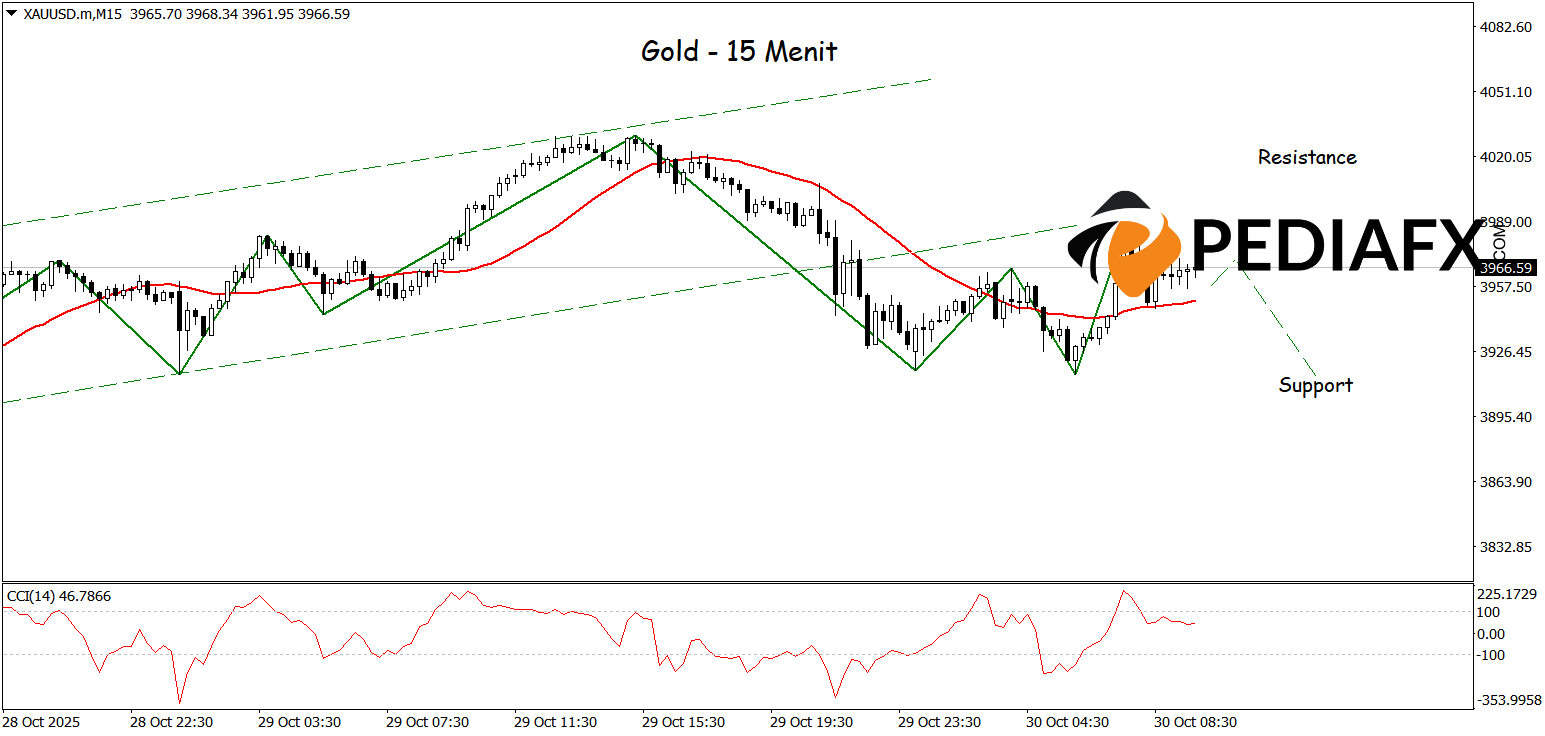
Gold is showing signs of weakness after breaking below the lower limit of a bullish channel on the 15-minute time frame, signaling a potential short-term trend reversal. The Moving Average (MA) line is beginning to flatten with a downward tendency, suggesting decreased buying momentum. Meanwhile, the CCI indicator is in the overbought territory, indicating that corrective pressure may continue. This combination of technical signals opens up possibilities for Gold to continue its decline, targeting a test of the crucial support level at $3,914.
Technical Reference: sell while below 4,014
Potential Stop Loss 1: 3,996
Potential Stop Loss 2: 4,014
Potential Take Profit 1: 3,934
Potential Take Profit 2: 3,914


