

The Gold price has started to exhibit signs of weakness on the 1-hour chart. The previously dominant bullish channel has been breached, indicating that buyer strength is waning. The ZigZag pattern and the Moving Average (MA) line further confirm the downward trend, showing that the upward momentum is starting to lose traction. This technical shift serves as an early warning to the market that a downward correction may be looming.
Bearish pressure is becoming increasingly apparent as the MACD indicator moves into negative territory, reinforcing the idea that sellers are gaining control. The combination of the broken channel, the confirmed ZigZag, the declining MA, and the negative MACD provides a consistent signal that Gold is likely to continue its correction in the short term. Traders should remain cautious of potential trend reversals, especially if nearby support levels are tested again.
Recommended

Recommended

Recommended

Recommended
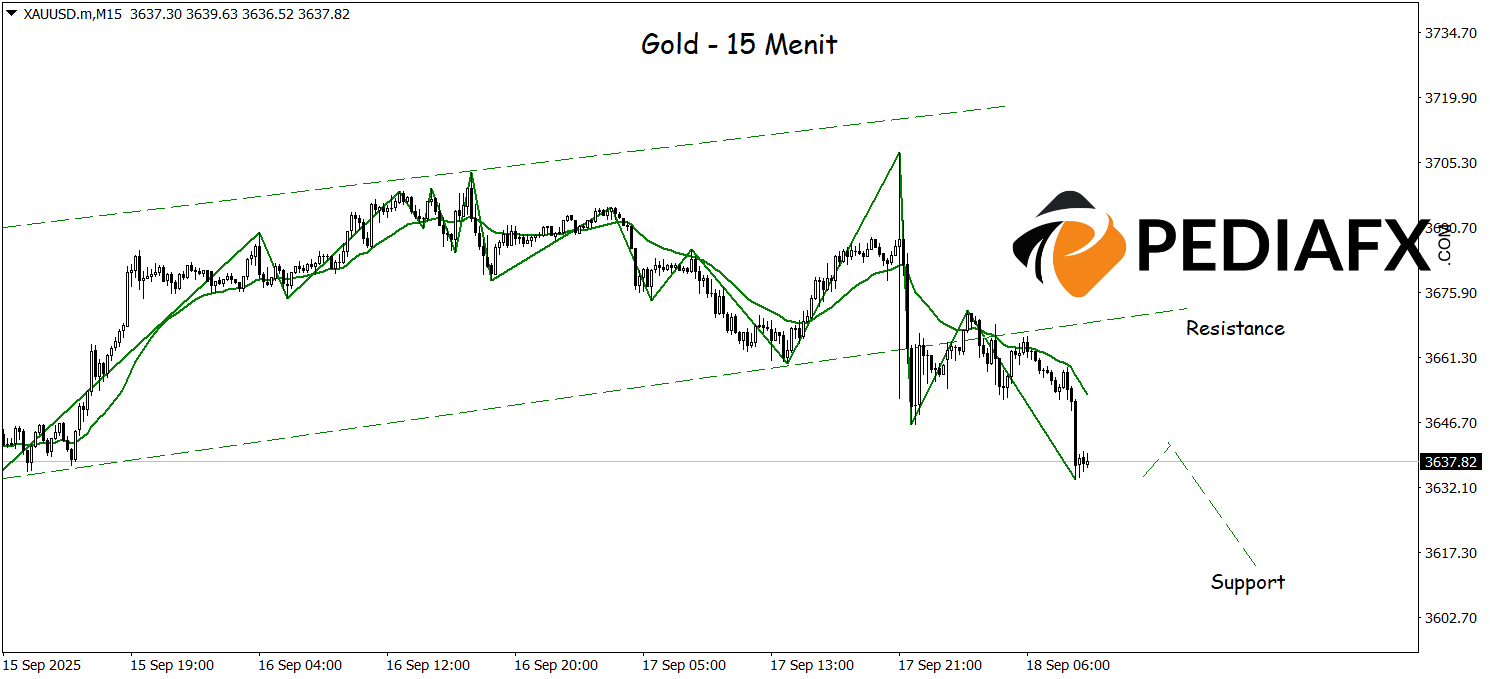
The break of the bullish channel in the 15-minute time frame indicates that Gold prices are shifting towards a bearish trend. The ZigZag pattern now confirms the downward movement by forming a bearish structure, while the sharply declining Moving Average (MA) further reinforces the weakening signal. With this technical setup, Gold may continue to face selling pressure, potentially testing the significant support area around $3,613.
Technical Reference: sell while below 3.663
Potential Stop Loss 1: 3.652
Potential Stop Loss 2: 3.663
Potential Take Profit 1: 3.622
Potential Take Profit 2: 3.613


