

A significant breakout from the triangle pattern has given an initial boost to Gold’s movement, allowing it to rebuild a solid bullish structure. After breaking through the consolidation zone, prices have formed a new resistance level and are now executing a neat pullback to the RBS area, indicating that buyers still control the market direction. On the 1-hour timeframe, the formation of a higher high and a higher low continues, serving as a technical signal that reinforces the dominance of buyers and opens up opportunities for further upward movement shortly.
Technical support is further enhanced by the rising position of the Moving Average, a consistent bullish zigzag pattern, and the MACD remaining in positive territory, which confirms that the upward momentum remains strong. As long as the HH–HL structure is preserved and prices can remain above the RBS area, Gold holds substantial potential for continuing its upward trajectory. Market focus is now on whether buyers can maintain purchasing pressure to push prices towards the next resistance.
Recommended

Recommended

Recommended

Recommended
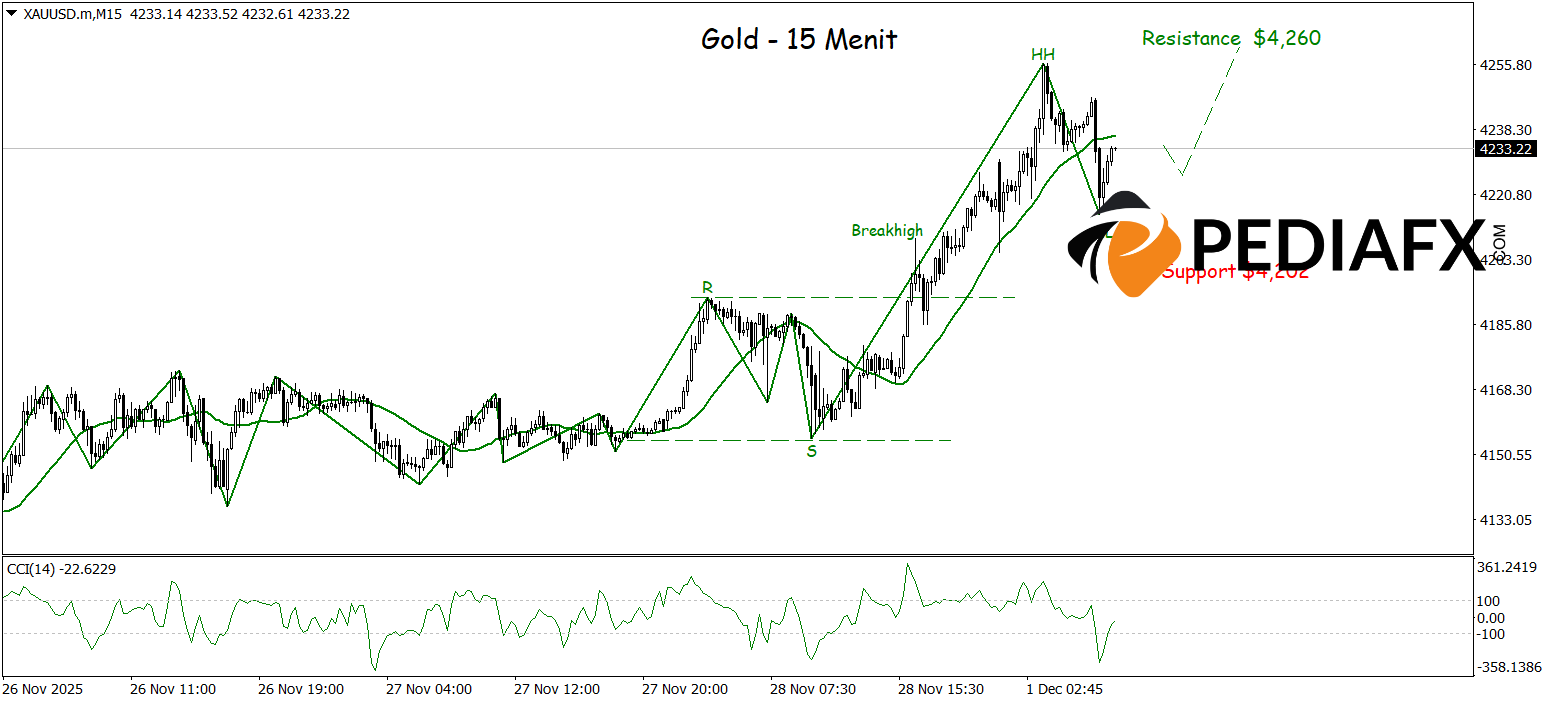
On the 15-minute timeframe, Gold has successfully broken out of the trading range between the support and resistance points, confirming the increasing strength of the buyer dominance. The market structure now reflects a solid HH–HL pattern, supported by a rising MA which signals a consistent bullish momentum. The CCI indicator has also rebounded from oversold territory, showing a revival in buying pressure, while the zigzag pattern emphasizes the ongoing uptrend. With this solid technical confluence, Gold has the potential to carry on with its rise and test the strong resistance around 4,260.
Technical Reference: buy while above 4,202
Potential Take Profit 1: 4,250
Potential Take Profit 2: 4,260
Potential Stop Loss 1: 4,213
Potential Stop Loss 2: 4,202


