

Gold has continued its upward rally after experiencing a significant correction last week. The formation of Higher High (HH) and Higher Low (HL) patterns on the hourly chart confirms that buyers are still firmly in control of the price direction. The ascending zigzag structure indicates a consistent bullish trend, while stable fundamental support keeps buying interest robust in the market. This movement also reflects that the previous selling pressure was merely temporary and was used as an accumulation opportunity by market participants.
From a technical standpoint, the combination of Moving Averages (MA) and the MACD is providing cohesive signals that suggest further price increases. The upward trajectory of the MAs and the positive MACD histogram underscore that the short-term bullish momentum continues to hold. As long as prices remain above the dynamic support level, the potential for further strengthening toward the next resistance area remains wide open. However, traders are advised to keep an eye on the possibility of a healthy correction before the next rally occurs.
Recommended

Recommended

Recommended

Recommended
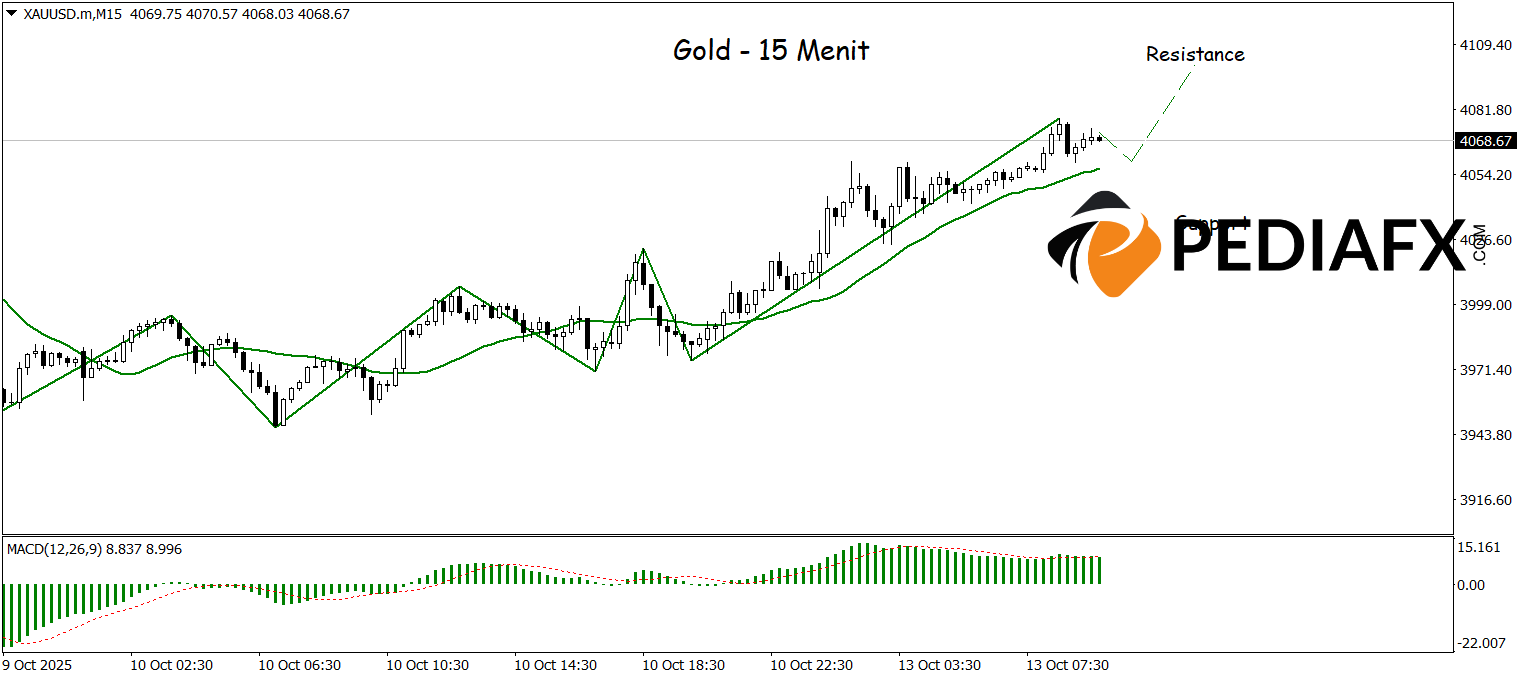
The bullish potential on the 15-minute chart still has opportunities to persist for Gold, supported by solid technical signals from the Moving Average (MA), ZigZag, and a cohesive MACD pointing toward an upward trend. The price structure continues to form Higher High (HH) and Higher Low (HL) patterns, signaling that the buyer dominance remains strong, while the positive momentum on the MACD boosts the likelihood of movements toward significant resistance around $4,100. As long as prices stay above the nearest support, the opportunity for testing this resistance remains widely open in short-term trading sessions.
Technical Reference: buy above 4,036
Potential Take Profit 1: 4,087
Potential Take Profit 2: 4,100
Potential Stop Loss 1: 4,048
Potential Stop Loss 2: 4,036


