

The potential for a short-term bullish trend is becoming evident in the movement of Gold on the 1-hour timeframe. The MACD indicator is reflecting positive momentum, with the histogram ascending towards the upper region of zero, indicating a strengthening buying pressure. Meanwhile, the current position of the Moving Average (MA) below the price is confirming a shift in technical structure from a corrective phase to an upward trend. This situation illustrates that selling pressure is beginning to wane as buyers gradually seize control of the price movement.
With increasingly solid technical support, the chances for Gold to rise further could continue during the European session this afternoon. If the bullish momentum is maintained, the price may be poised to test the nearest resistance level before defining its next direction. However, traders are advised to closely monitor price reactions around these key areas to anticipate potential brief pullbacks. Overall, the intraday bias remains positive as long as the price holds above the dynamic support area created by the MA.
Recommended

Recommended

Recommended

Recommended
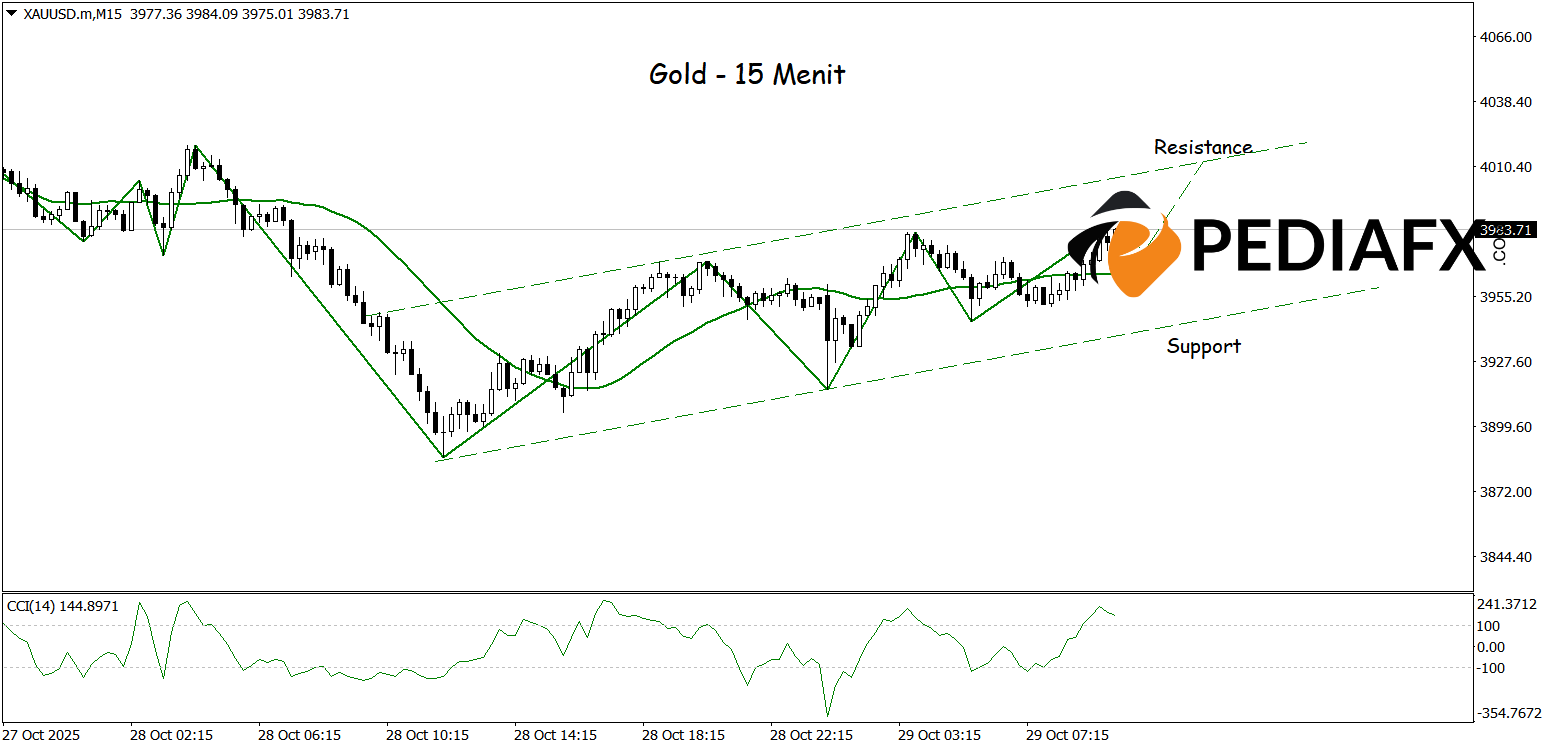
On the 15-minute chart, the upward trend of Gold is becoming increasingly apparent with the Moving Average (MA) trending upwards in alignment with a ZigZag pattern that is also forming a higher high structure. Both elements reinforce the signal that bullish momentum remains dominant, with prices currently attempting to test the nearest resistance area around the $4,015 level.
Technical References: buy while above 3,936
Potential Take Profit 1: 3,999
Potential Take Profit 2: 4,015
Potential Stop Loss 1: 3,950
Potential Stop Loss 2: 3,936


