

The price of Gold continues to impress, inching closer to its all-time highs after successfully breaking above the upper boundary of the Bollinger Bands. This breakout serves as a strong signal that buying pressure is dominating the market, creating opportunities for Gold to extend its upward trend. This movement is further supported by an increase in trading volume, indicating investor confidence in the upward momentum.
Moreover, the MACD indicator is providing clear bullish signals, with the MACD line positioned above the signal line and the histogram reflecting a continuously rising positive momentum. The combination of the Bollinger Bands breakout and bullish MACD signals suggests that Gold prices could potentially reach the next resistance level.
Recommended

Recommended

Recommended

Recommended
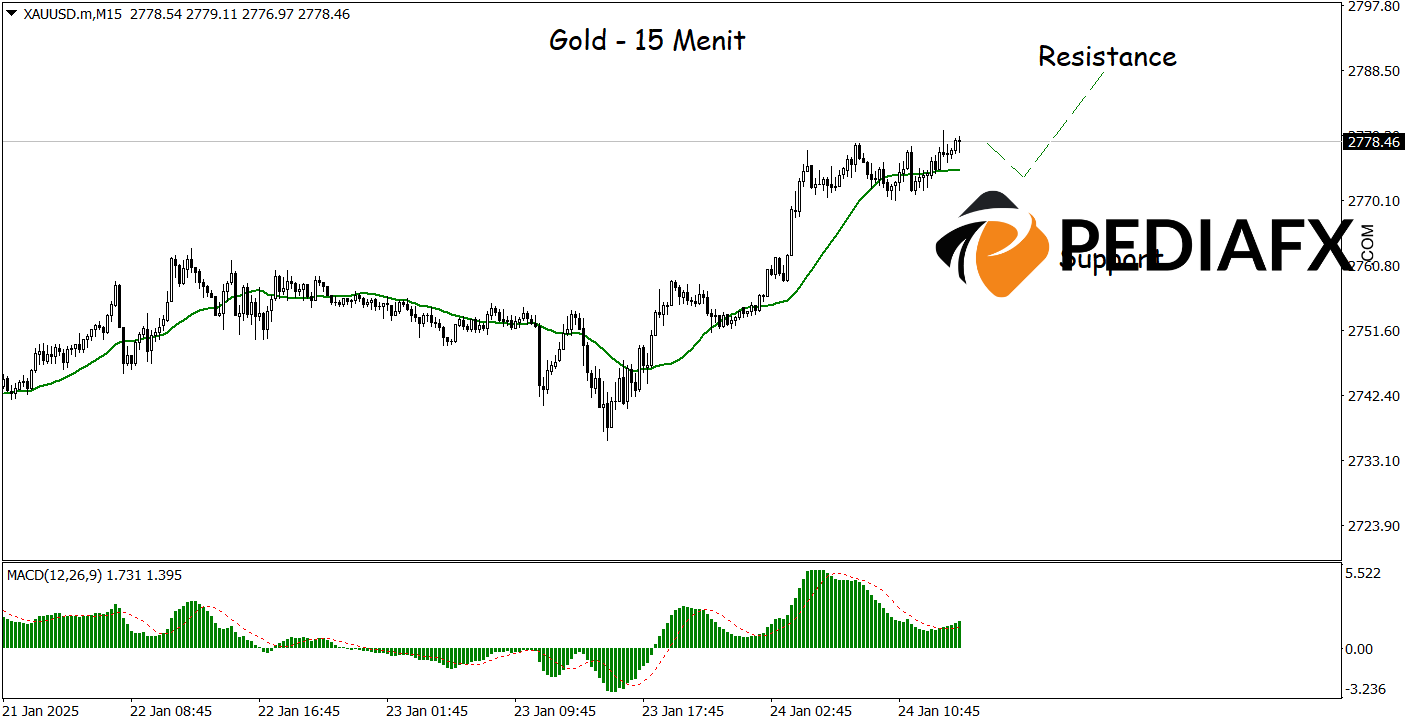
On the 15-minute chart above, Gold is beginning to exhibit signs of increasing values as the moving average sharply trends upward, indicating that the bullish trend remains solid. The MACD indicator also reinforces the notion of strengthening bullish conditions, with growing buying momentum. If this scenario unfolds as anticipated, Gold prices may approach a resistance level at $2,788.00.
Technical Reference: buy while above 2,763.00
Potential Take Profit 1: 2,783.00
Potential Take Profit 2: 2,788.00
Potential Stop Loss 1: 2,769.00
Potential Stop Loss 2: 2,763.00


