

Gold continues to hover within a trading range that has persisted over the past week, currently forming a triangle pattern. This pattern is evident through the red and blue lines on the chart, indicating a consolidation phase that awaits a breakout moment. Until one side is convincingly breached, Gold’s movements are likely to be restrained as it seeks a clear direction. However, it is important to note that a triangle pattern typically signifies a continuation, suggesting that a significant price movement could occur once one of its boundaries is decisively broken.
Examining further opportunities, technical indicators reveal a bearish bias. The zigzag pattern is trending downwards, the Moving Average is positioned above the current price, and the MACD is situated in negative territory. This combination exerts additional pressure on Gold during today’s European trading session, indicating that any short-term gains are likely to face selling pressure. As long as the technical structure remains unchanged, the risk of further declines continues to outweigh the possibilities of a reversal.
Recommended

Recommended

Recommended

Recommended
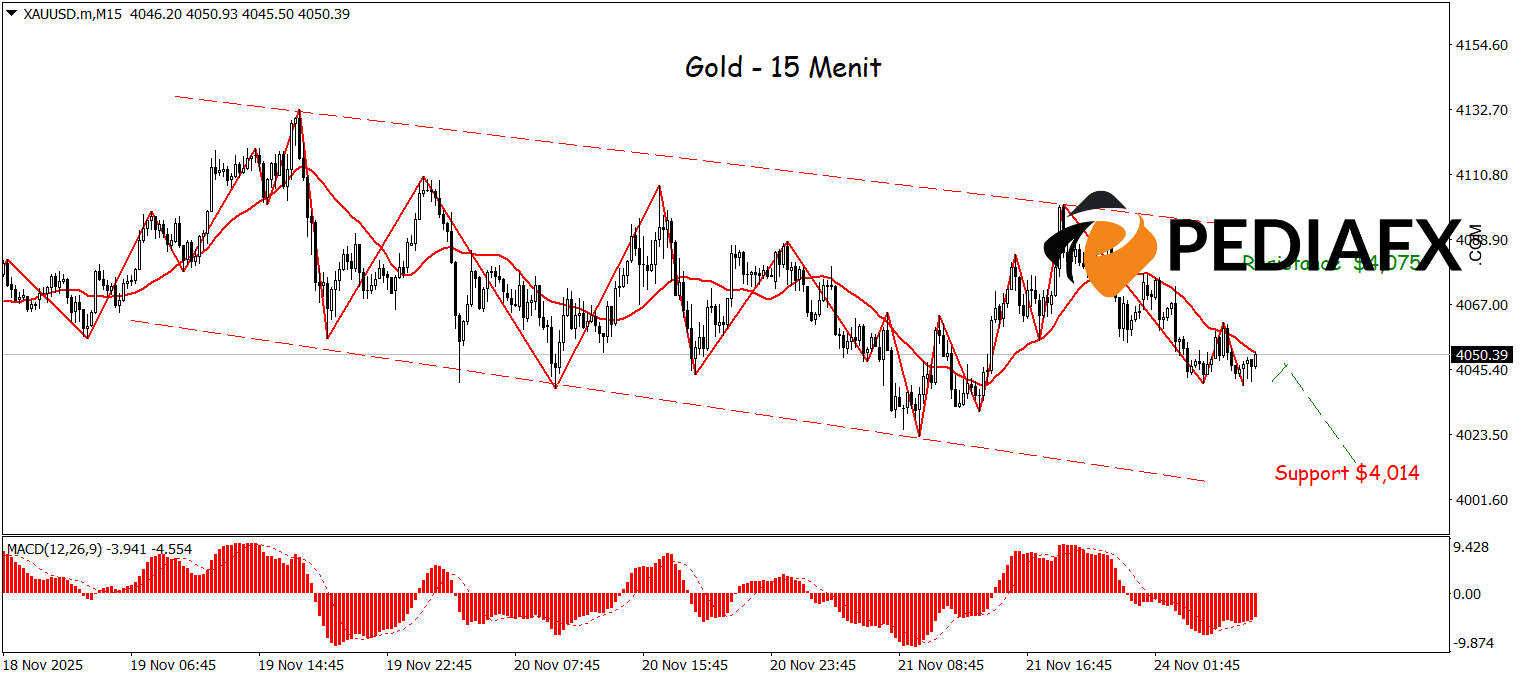
The 15-minute chart for Gold illustrates movement still trapped within a bearish channel, reinforcing the dominance of selling pressure in the short term. The sharply declining slope of the Moving Average indicates a continued bearish momentum, while the zigzag pattern consistently forms a downward structure aligned with the current trend. The MACD remaining in negative territory further strengthens the bearish outlook, opening up the potential for Gold to extend its weakening and test a crucial support level at 4,014 in the near future.
Technical Reference: sell while below 4,075
Potential Stop Loss 1: 4,066
Potential Stop Loss 2: 4,075
Potential Take Profit 1: 4,026
Potential Take Profit 2: 4,014


