

The price of gold is showing strong bullish potential on the 1-hour timeframe after successfully breaking through the bearish channel. This movement indicates that selling pressure is starting to weaken while buyers are gaining control over the price direction. The breakout from the channel serves as an early signal that an upward momentum is forming, bolstered by rising levels of support. This condition reflects a shift in market sentiment towards a more positive outlook, where market participants are beginning to see short-term reversal opportunities.
From a technical perspective, the Moving Average (MA) indicator is increasingly exhibiting a clear bullish trend, while the ZigZag pattern is forming a higher low structure that reinforces the bullish bias. As long as the price can hold above the breakout area and does not return to breach the dynamic support, the likelihood of gold strengthening in the short term remains robust. If buying pressure continues, gold could further its rally towards the nearest resistance area as the next target.
Recommended

Recommended

Recommended

Recommended
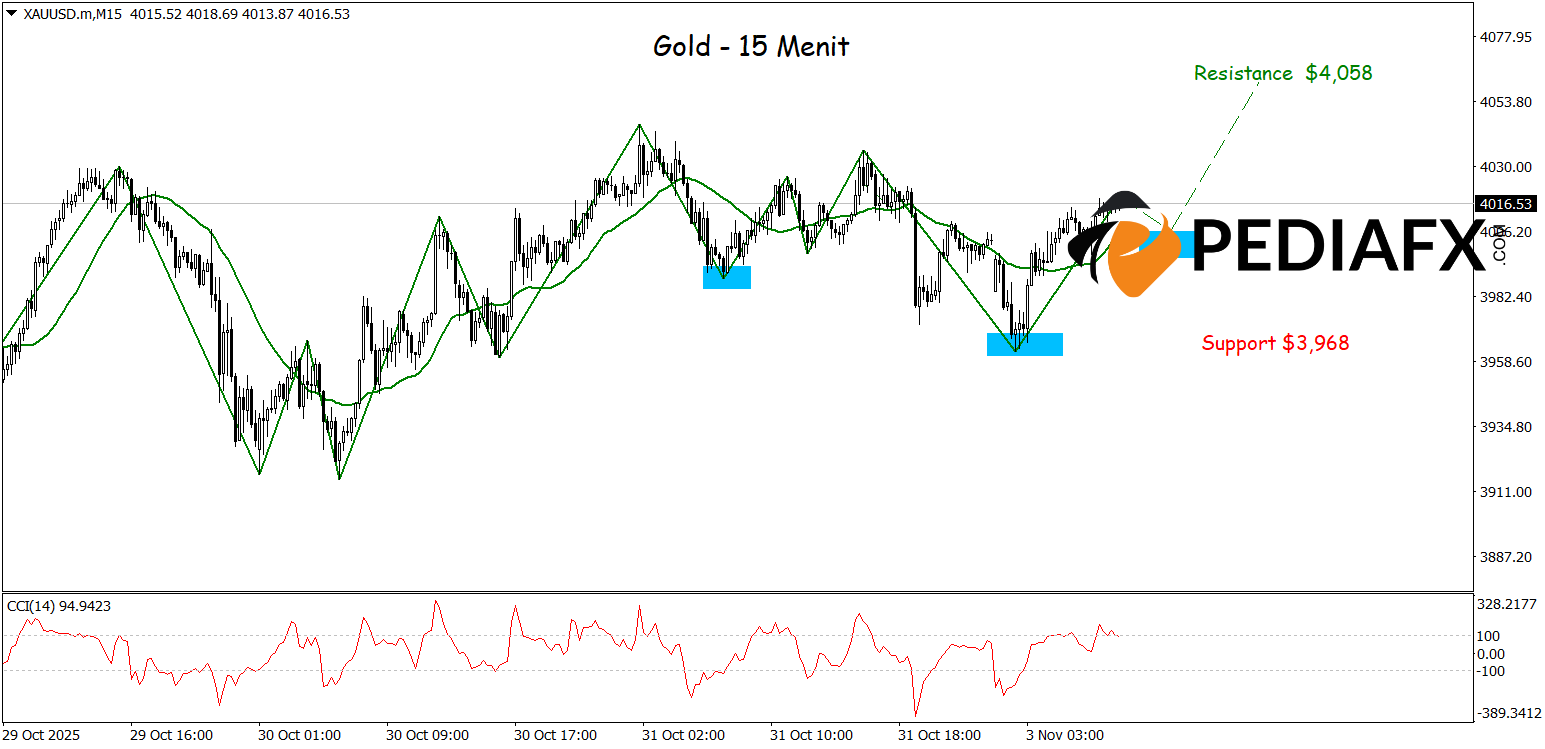
On the 15-minute chart, gold is starting to show increasingly clear bullish opportunities after forming an inverse head and shoulders pattern (highlighted in blue) as a potential reversal signal. This pattern indicates that selling pressure is beginning to ease, and buyers are starting to take over the momentum. Additionally, technical indicators such as the Moving Average (MA) and ZigZag are still moving in the same direction, strengthening the prospects for a price increase in the near term. As long as the price remains above the neckline of this pattern, gold has the potential to continue its upward movement to test the resistance area around $4,058.
Technical Reference: buy if above 3,968
Potential Take Profit 1: 4,042
Potential Take Profit 2: 4,058
Potential Stop Loss 1: 3,983
Potential Stop Loss 2: 3,968


