

The price of gold continues its impressive rally, reaching a new all-time high in history. Market sentiment remains highly favorable towards this safe-haven asset, fueled by growing expectations for interest rate cuts by the Federal Reserve next year. An observable pattern of Higher High – Higher Low (HH–HL) is evident on the chart, indicating a strong upward trend. The ZigZag indicator further reinforces this bullish structure, as highs and lows consistently emerge in line with the ongoing buying pressure in the market.
Additional support is provided by the upward movement of the Moving Average (MA) and positive MACD signals, suggesting that the bullish momentum remains robust. As long as the price stays above the main MA, the potential for testing the next resistance remains wide open. However, traders are advised to remain cautious of potential short-term corrections due to profit-taking at these high levels. As long as the HH–HL pattern is maintained, the medium-term outlook for gold is expected to continue towards higher price areas.
Recommended

Recommended

Recommended

Recommended
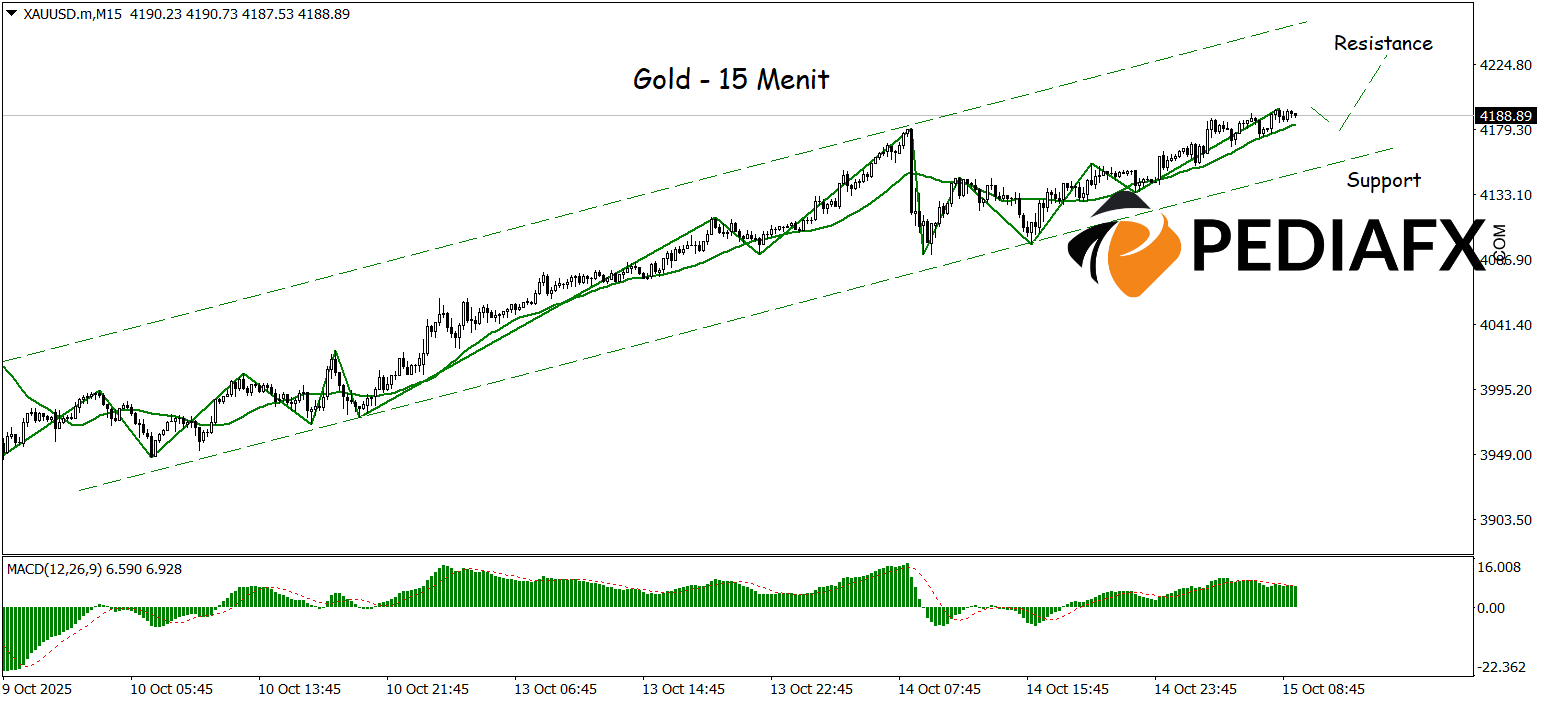
The bullish channel that has formed on the 15-minute time frame further enhances the potential for gold to test the next resistance area around $4,232. The price structure moving within this upward channel shows a continued dominance of buying pressure, consistent with the overall prevailing bullish trend. Technical support also comes from the ascending position of the Moving Average (MA) and the MACD indicator remaining in positive territory, indicating that the upward momentum is still strong and the likelihood of resistance breakout remains feasible in the short term.
Technical References: buy while above 4,150
Potential Take Profit 1: 4,220
Potential Take Profit 2: 4,232
Potential Stop Loss 1: 4,160
Potential Stop Loss 2: 4,150


