

The potential for a correction in Gold is becoming apparent on the 1-hour timeframe after the price was unable to achieve a higher high (HH), which previously indicated a continuation of the upward trend. This failure suggests a weakening of the bullish momentum, as prices are now beginning to move below the downward-sloping Moving Average (MA). This shift indicates a change in short-term market structure from an uptrend to a corrective phase.
Moreover, the MACD indicator has also started to dip into negative territory, reinforcing the signals of a potential decline in the near future. If selling pressure persists, short-term bearish opportunities could arise towards the nearest support level. Traders are advised to monitor price reactions at this support area as a potential bounce zone or further confirmation if selling pressure intensifies.
Recommended

Recommended

Recommended

Recommended
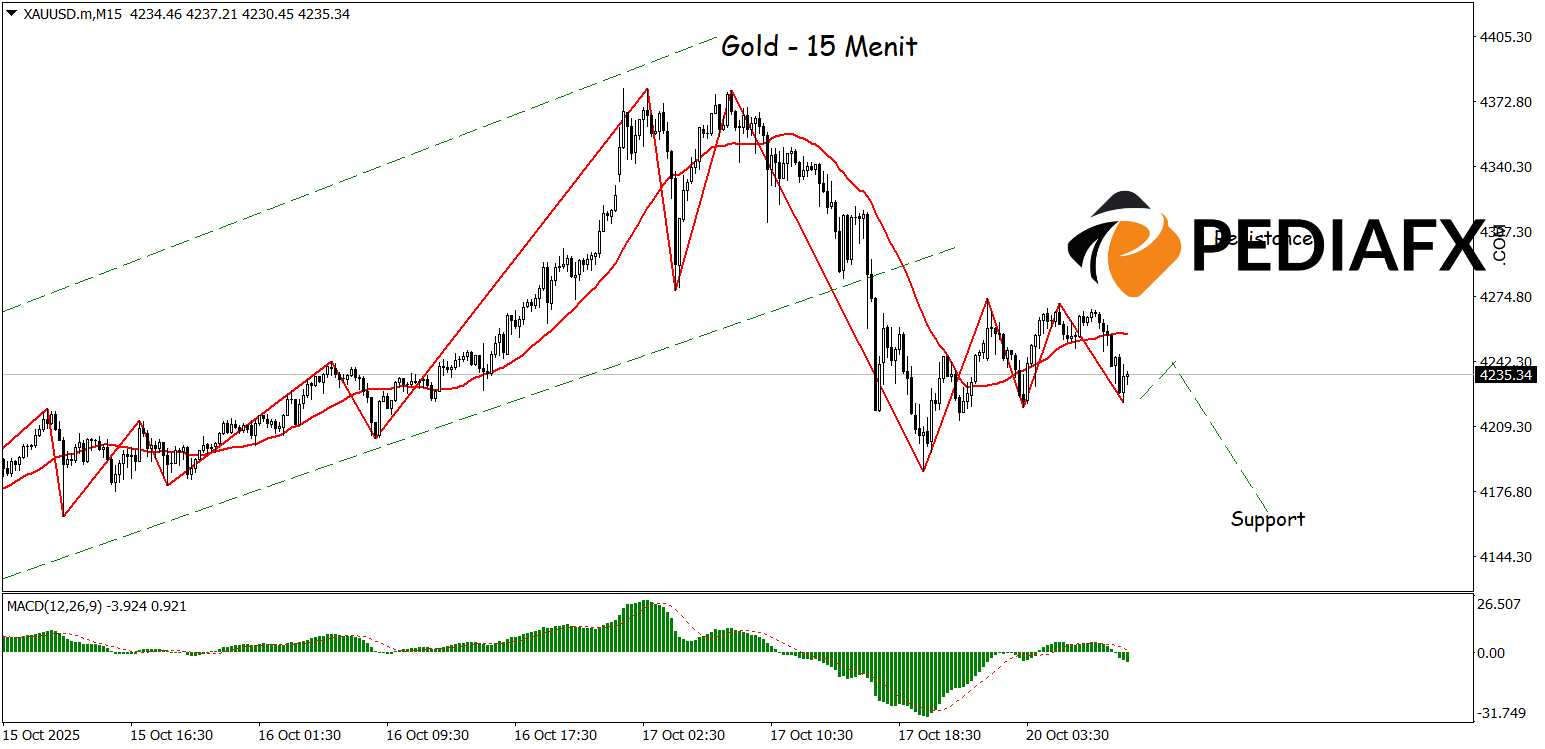
A breach of the bullish channel support serves as a signal that Gold is beginning to show bearish potential on the 15-minute timeframe. Selling pressure is increasingly evident following the price breaking below this level, aligning with the downward movement of the Moving Average (MA) and with the ZigZag indicator confirming a trend structure change. This condition opens up prospects for further declines, with the nearest correction target expected to test the support zone around the $4,166 level.
Technical Reference: buy above 4,298
Potential Take Profit 1: 4,276
Potential Take Profit 2: 4,298
Potential Stop Loss 1: 4,186
Potential Stop Loss 2: 4.166


