

The price of Gold has reversed direction after breaching a bearish trendline on the 1-hour timeframe, signaling the end of a short-term strengthening phase. The selling pressure has increased as the price sets a new daily low, while the moving average line shows a downward slope, confirming a trend reversal towards the negative side. Additionally, the formed Zigzag pattern also indicates a gradual declining structure, suggesting that bearish pressure still has room to continue in the near term.
Given the current technical conditions, Gold is likely to continue declining towards the nearest support area, which is crucial for measuring the strength of the next selling wave. If the price fails to hold at this level, there could be further corrections towards deeper support. However, if a bounce occurs from the lower area, a temporary consolidation phase cannot be ruled out. For now, a prevailing negative sentiment remains the primary factor influencing Gold’s short-term movements.
Recommended

Recommended

Recommended

Recommended
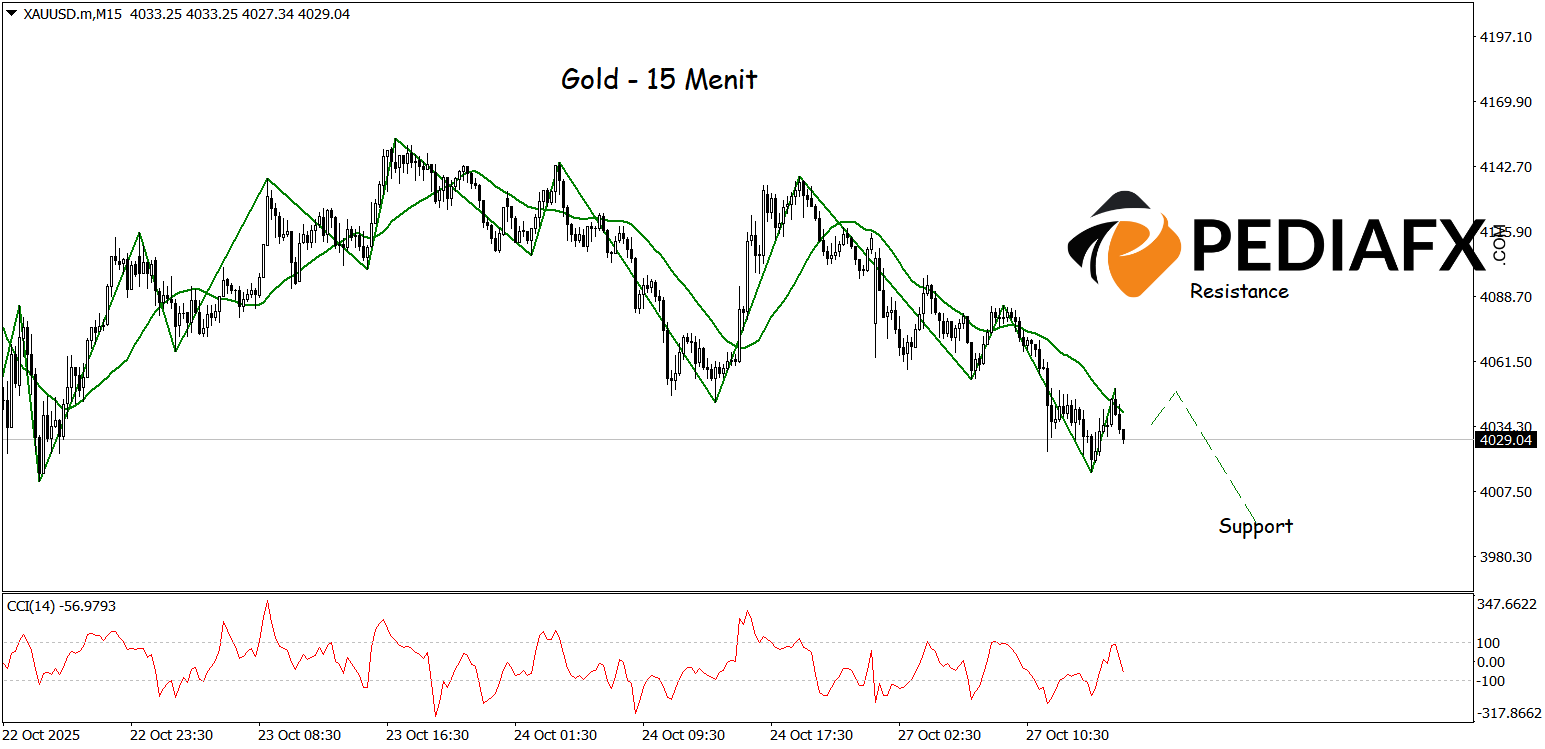
On the 15-minute timeframe, Gold’s movement is starting to exhibit signs of weakening as both the Zigzag and moving average are trending downward, indicating increasingly evident selling pressure. Conversely, the CCI being in the overbought zone strengthens the potential for a technical correction soon, as the previous upward momentum subsides. As long as the price remains under this pressure, the support level of 3,994 becomes a significant area that could be tested to gauge the strength of any further declines, with the current intraday bias leaning towards bearish.
Technical Reference: buy while above 4,086
Potential Take Profit 1: 4,070
Potential Take Profit 2: 4,086
Potential Stop Loss 1: 4,008
Potential Stop Loss 2: 3,994


