

The movement of Gold on the hourly chart is starting to exhibit signs of a directional change after successfully breaking through the upper limit of the bullish channel. This breakthrough serves as an initial signal indicating that selling pressure is easing, and the potential for a trend shift from bearish to bullish is beginning to take shape. The buying activity around the breakout area illustrates that market participants are responding favorably to this upward momentum. The price’s return above the channel structure also reinforces the expectation that Gold has the opportunity to continue strengthening towards the nearest resistance area in the near future.
From a technical perspective, the upward direction of the Moving Average (MA) and the position of the MACD moving into positive territory provide additional confirmation of this trend shift potential. These conditions suggest that buying pressure is intensifying, while market sentiment is beginning to favor the upward movement. As long as the price remains above the breakout area and does not fall back below the channel, the possibility for Gold to extend its bullish momentum will remain open, with targets aimed at testing subsequent resistance levels.
Recommended

Recommended

Recommended

Recommended
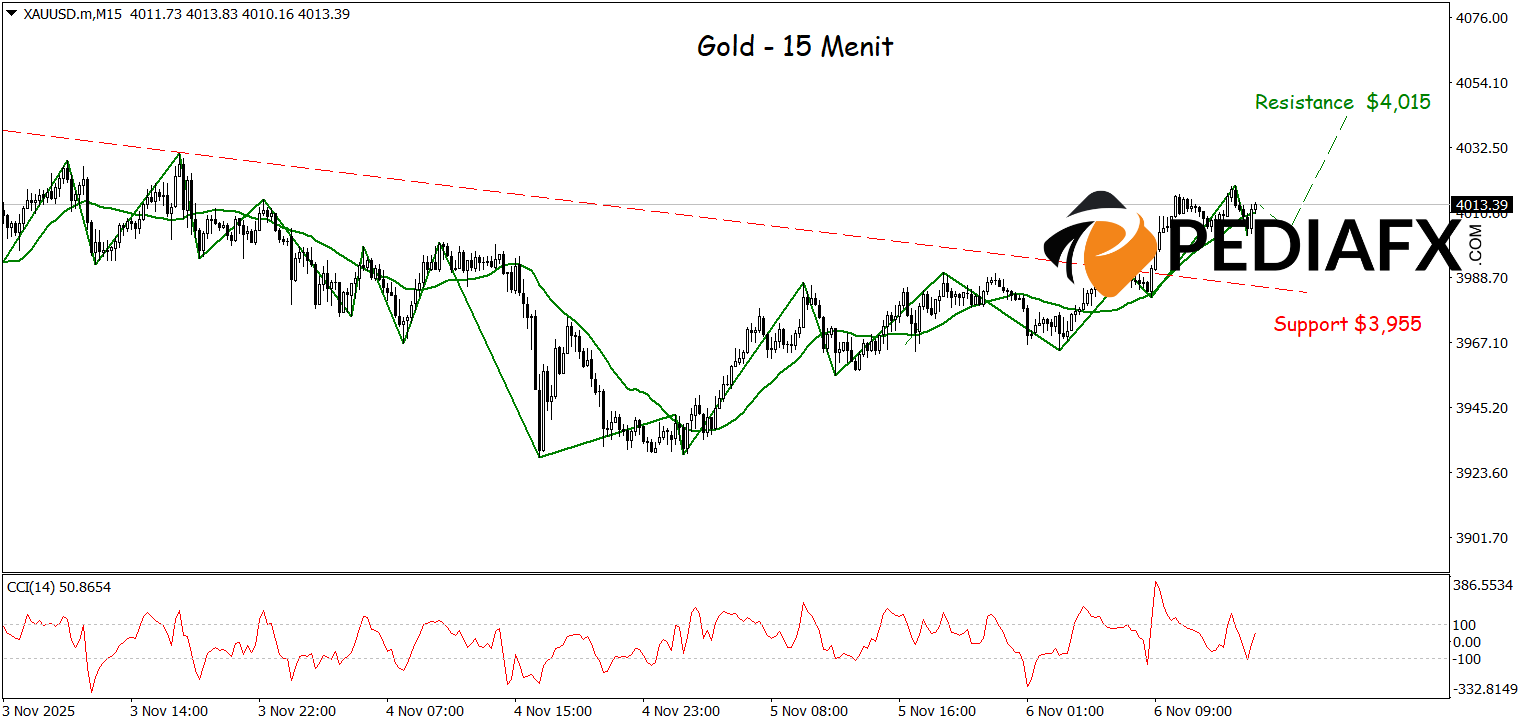
Gold is showing signs of strength after successfully breaking through the bearish trendline on the 15-minute chart, indicating a directional change from selling pressure towards new buying momentum. Technical signals are increasingly confirming the likelihood of an upward move, with both the Moving Average (MA) and the ZigZag pattern breaking previous highs, while the CCI indicator is in an oversold zone, suggesting potential reversal. This combination of signals opens up opportunities for Gold to continue its ascent, aiming to test the resistance area around the level of 4,042 in tonight’s US session.
Technical Reference: buy above 3,976
Potential Take Profit 1: 4,030
Potential Take Profit 2: 4,042
Potential Stop Loss 1: 3,985
Potential Stop Loss 2: 3,976


