

The hourly chart of EURUSD is beginning to indicate a trend transition from upward to downward. A break of the low in the bearish channel serves as an initial trigger for this directional change, signifying that buyers are starting to lose control. The price structure exhibiting Lower High (LH) and Lower Low (LL) patterns increasingly reinforces that bearish pressure is developing. This indication suggests that sellers may potentially seize dominance in short-term movements, particularly during the US trading session.
Additionally, the downward trajectory of the Bollinger Bands (BB) further strengthens the bearish signal. The widening of the bands downward indicates an increase in volatility leaning towards selling pressure, creating space for EURUSD to continue its decline. If bearish pressure persists, the price could test the next support level, reinforcing the view that the downward trend could remain in place in the near future.
Recommended

Recommended

Recommended

Recommended
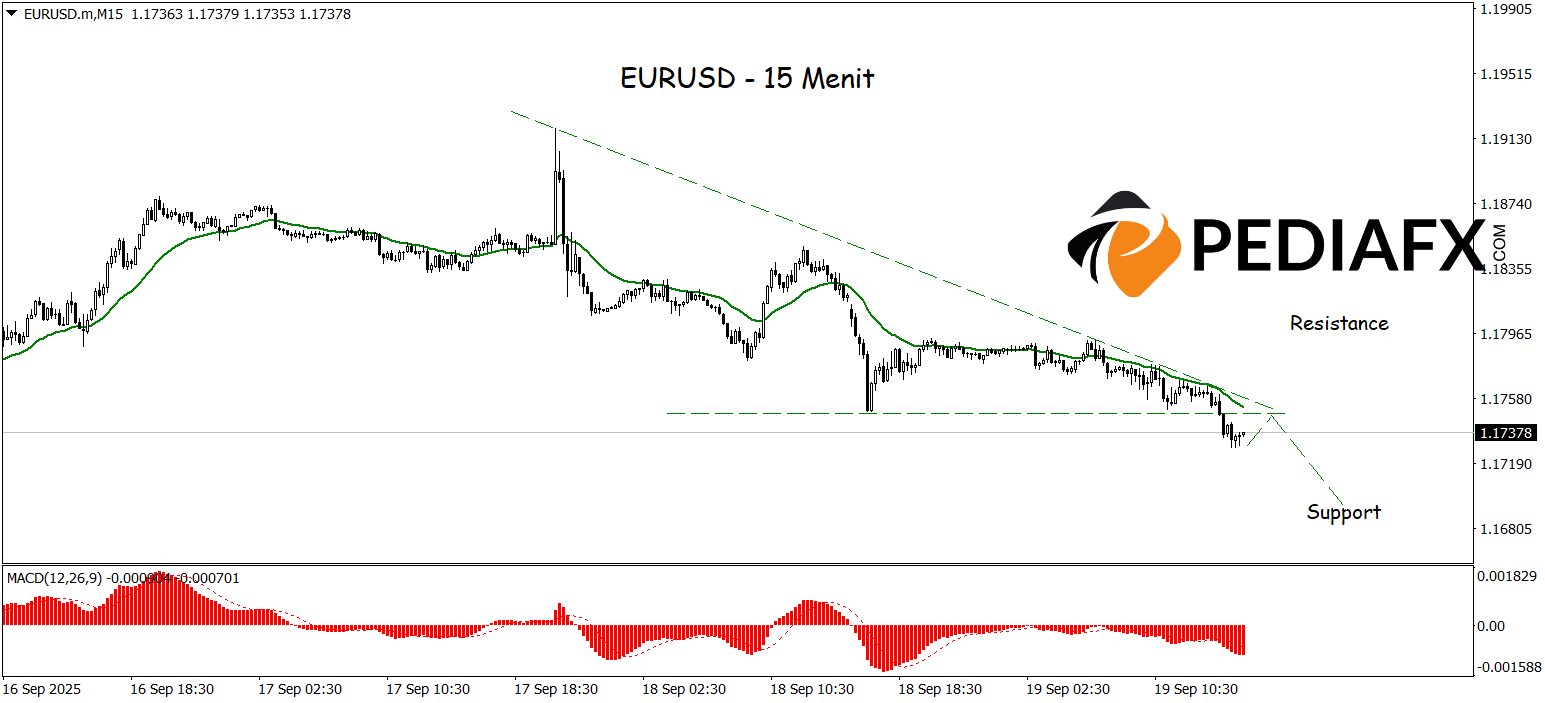
The formation of an ascending triangle in the 15-minute timeframe has been breached, signaling the next movement direction for EURUSD, where selling pressure remains dominant alongside a declining MA line and MACD positioned in negative territory. This technical combination presents an opportunity for EURUSD to move lower with a target to test the support level around 1.16955.
Technical Reference: sell while below 1.17945
Potential Stop Loss 1: 1.17760
Potential Stop Loss 2: 1.17945
Potential Take Profit 1: 1.17140
Potential Take Profit 2: 1.16955


