

The GBPUSD pair is currently navigating through a lengthy cycling phase, characterized by movements within a relatively confined range but marked by high volatility. This type of price motion has culminated in the formation of a descending triangle, a technical structure that typically serves as a crucial indicator for determining the subsequent major direction. This pattern reflects an increasing pressure from sellers, while buyers seem to be losing strength in supporting the support area. A breakthrough to either side, especially to the downside, may prompt GBPUSD to embark on a new, more decisive trend phase.
Technical indicators further validate the potential for short-term bearish pressure. The Zigzag pattern indicates a downward tendency, coinciding with the downward trajectory of the Moving Average line, which confirms a loss of earlier bullish momentum. Additionally, the CCI reading within the overbought territory suggests that any ongoing pullbacks may be limited before the market resumes its decline. Considering these elements, the prospect for GBPUSD to weaken appears more pronounced as long as the price remains confined within the descending triangle structure and fails to breach the key resistance above.
Recommended

Recommended

Recommended

Recommended
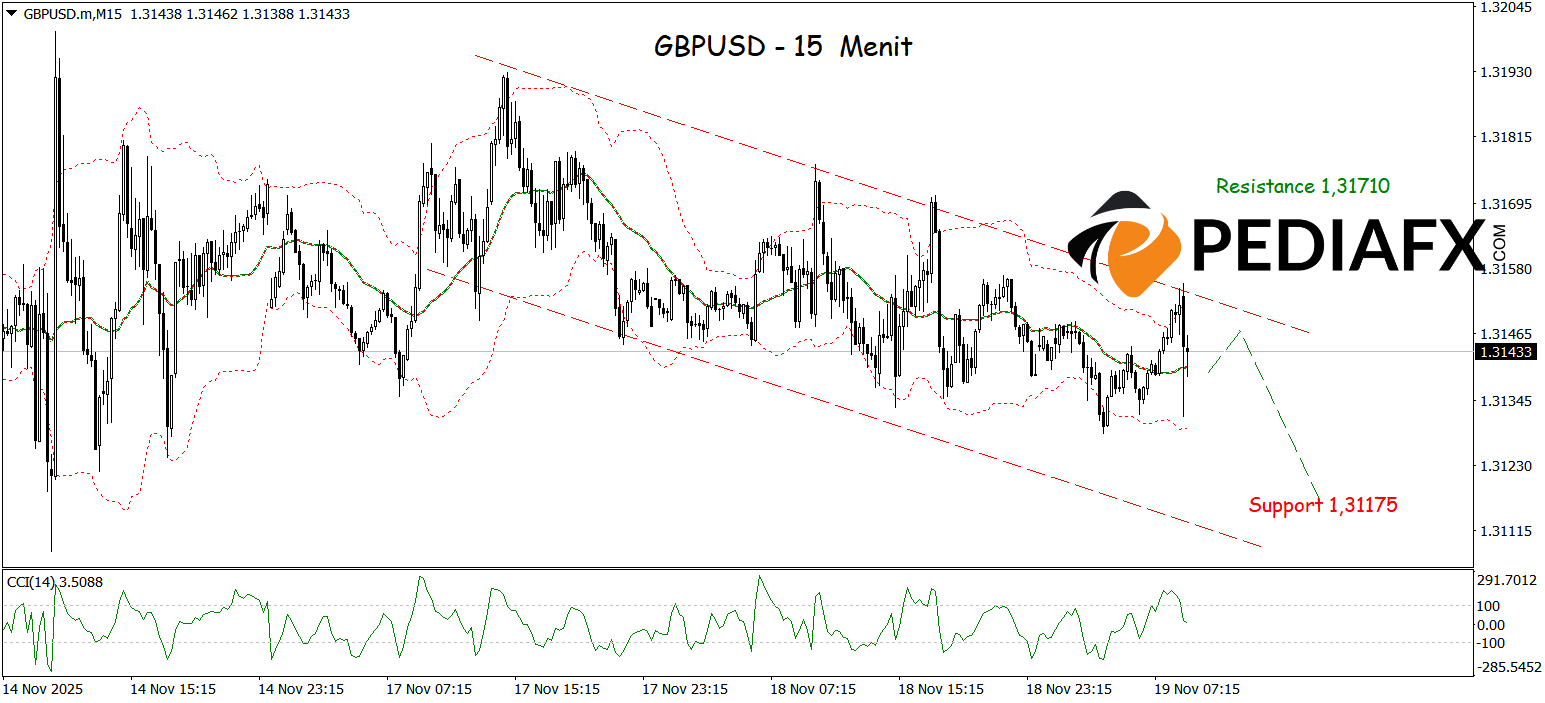
The GBPUSD price has once again faced rejection from the resistance provided by the Bollinger Bands, which coincides with the resistance of the bearish channel, indicating that seller pressure continues to prevail. The overbought conditions of CCI further reinforce the likelihood of a downward correction in the near term. With this combination of technical signals, there is a possibility for GBPUSD to continue its decline to test the support level around 1.31175.
Technical Reference: buy above 1.31710
Potential Take Profit 1: 1.31610
Potential Take Profit 2: 1.31710
Potential Stop Loss 1: 1.31265
Potential Stop Loss 2: 1.31175


