

The Nasdaq presents a promising reversal opportunity after successfully establishing a clear double bottom pattern on the 1-hour timeframe. The zigzag structure that records low levels in the same vicinity further reinforces the signal that selling pressure is beginning to wane. This pattern typically indicates a strong likelihood that the market is in an accumulation phase before a potential rebound. Additionally, the Moving Average (MA) line, which is starting to flatten after a sharp decline, suggests price stabilization, allowing buyers to re-enter the market.
The momentum for recovery is also reflected in the CCI indicator, which is beginning to rebound from the oversold region. This rebound signifies an uptick in buying pressure and a resurgence of buyer interest. If the buying pressure continues, the Nasdaq has a good chance of strengthening further and moving out of the established bottoming area. With a combination of supportive technical signals, the potential for a short-term rebound appears increasingly feasible, and the Nasdaq is poised to test nearby resistance levels as an initial step toward recovery.
Recommended

Recommended

Recommended

Recommended
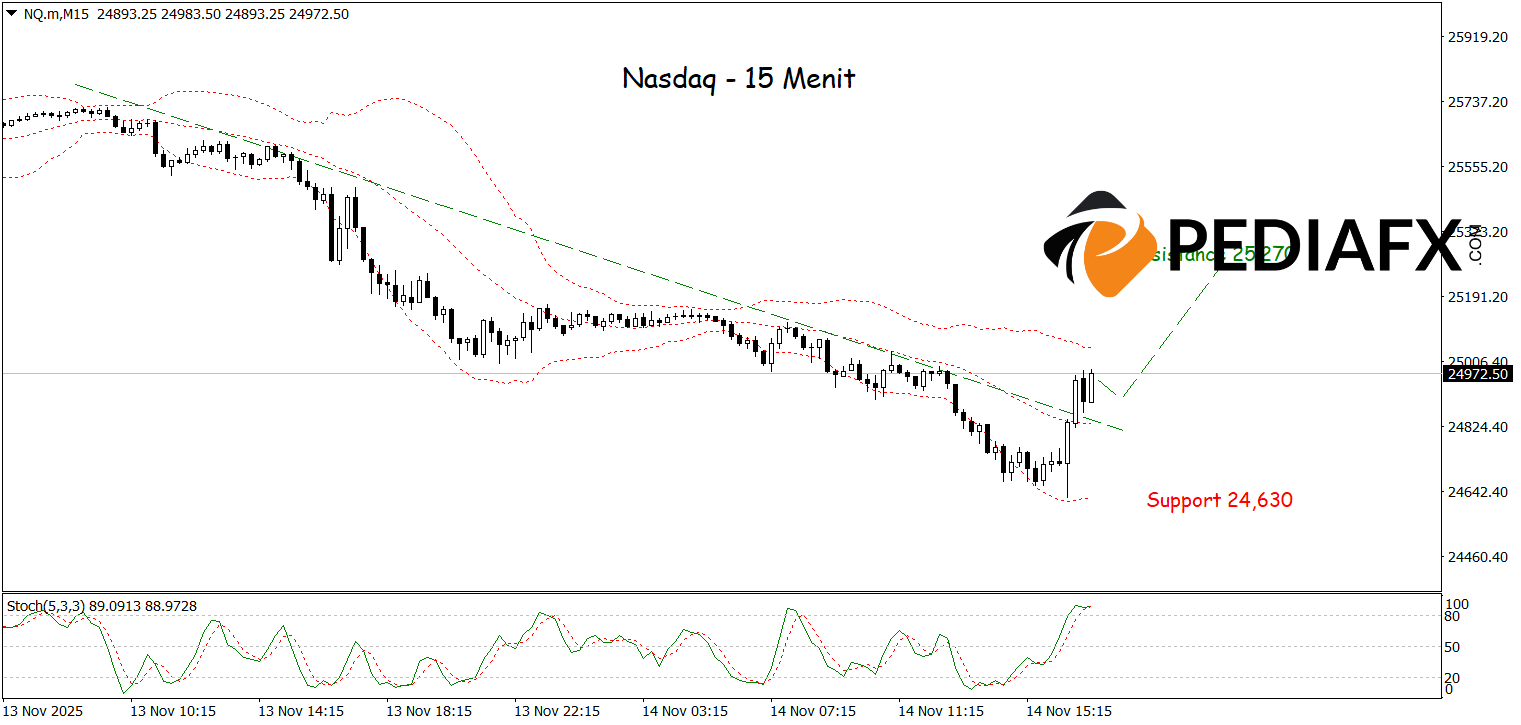
The Nasdaq exhibits signs of a directional reversal after the price breaks above the bearish trendline that previously capped upward movement. A strong rebound from the lower area of the Bollinger Bands (BB) further underscores that selling pressure is diminishing and buyers are starting to take control of the momentum. With this combination of technical signals, the Nasdaq is in a favorable position to continue its ascent and is ready to test a significant resistance level at 25,270 in the near term.
Technical Reference: buy while above 24,630
Potential Take Profit 1: 25,168
Potential Take Profit 2: 25,270
Potential Stop Loss 1: 24,752
Potential Stop Loss 2: 24,630


