

USDJPY is currently experiencing intense selling pressure, marked by a break below the lower Bollinger Bands. This breach indicates a significant bearish momentum, as prices are moving outside the normal volatility range. The middle line of the Bollinger Bands now serves as a dynamic resistance, reinforcing the ongoing downward pressure.
The MACD indicator further confirms the bearish trend, with a widening negative histogram and the MACD line positioned well below the signal line. The combination of these indicators suggests that USDJPY is likely to continue its downward trajectory.
Recommended

Recommended

Recommended

Recommended
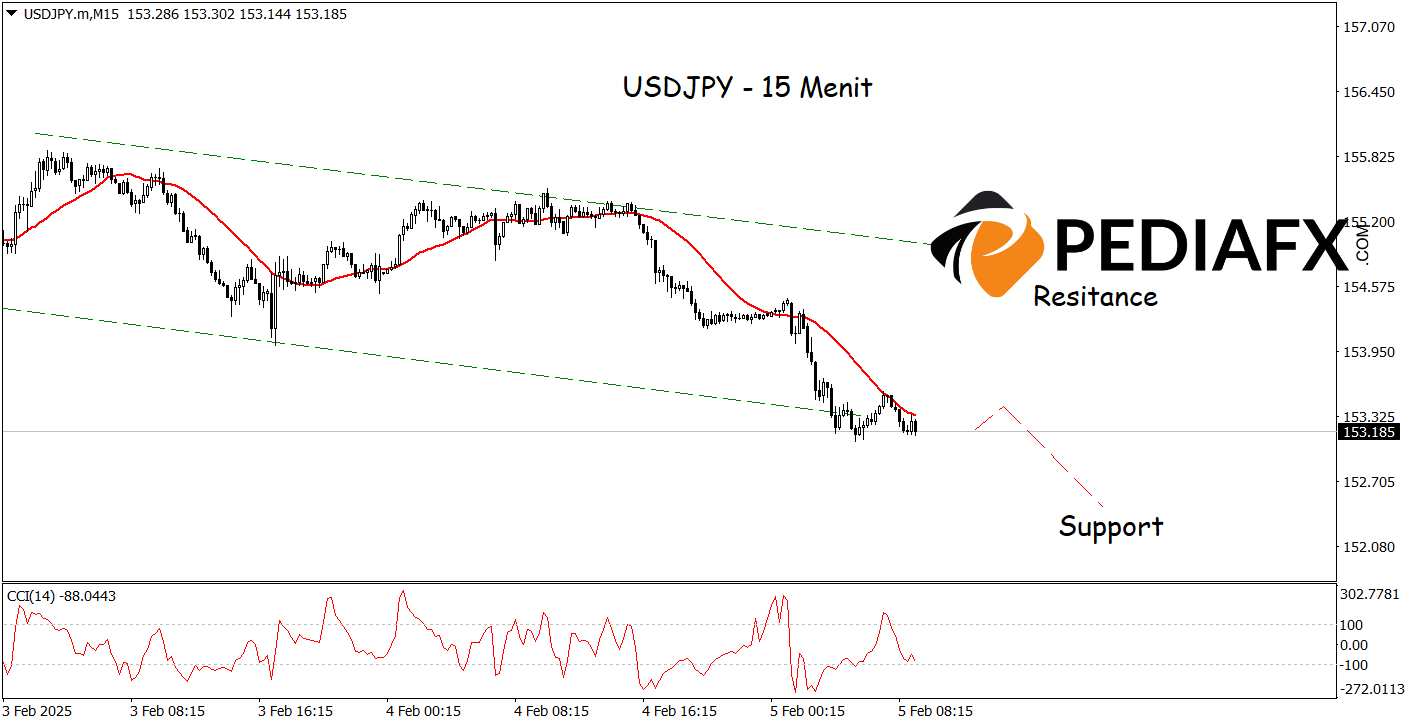
On the 15-minute timeframe, USDJPY also displays strong bearish signals, with the Moving Average (MA) indicator confirming a price decline. The consistent positioning of prices below the MA line indicates dominant selling pressure. Additionally, the Commodity Channel Index (CCI) strengthens the potential for further declines, as the CCI value dips below -100, signifying an ongoing oversold condition. If this scenario plays out, USDJPY could potentially drop to test the support level of 152.400.
Technical References: sell while below 154.345
Potential Stop Loss 1: 153.935
Potential Stop Loss 2: 154.345
Potential Take Profit 1: 152.785
Potential Take Profit 2: 152.400


