

The EURUSD currency pair continues to experience consistent bearish pressure, as indicated by the downward trajectory of the Bollinger Bands (BB) and the Zigzag indicator, which is continuously forming lower highs and lower lows on the 1-hour chart. Both technical signals reinforce the notion that selling pressure remains dominant, while the price shows no strong signs of reversal. This situation reflects the market participants’ preference for selling positions, especially after several unsuccessful rebound attempts to breach the dynamic resistance area. The current trend structure illustrates that the bearish momentum is well-maintained.
As the European session unfolds, the potential for further declines remains significant as long as the price trades below the middle line of the Bollinger Bands and fails to break through the nearest resistance. If selling pressure persists, the EURUSD may be on course to test the next support area, which serves as a reference point for short-term traders. However, should an upward correction occur, it is likely to be merely technical before the primary trend resumes. Thus, the overall bias remains tilted toward the negative.
Recommended

Recommended

Recommended

Recommended
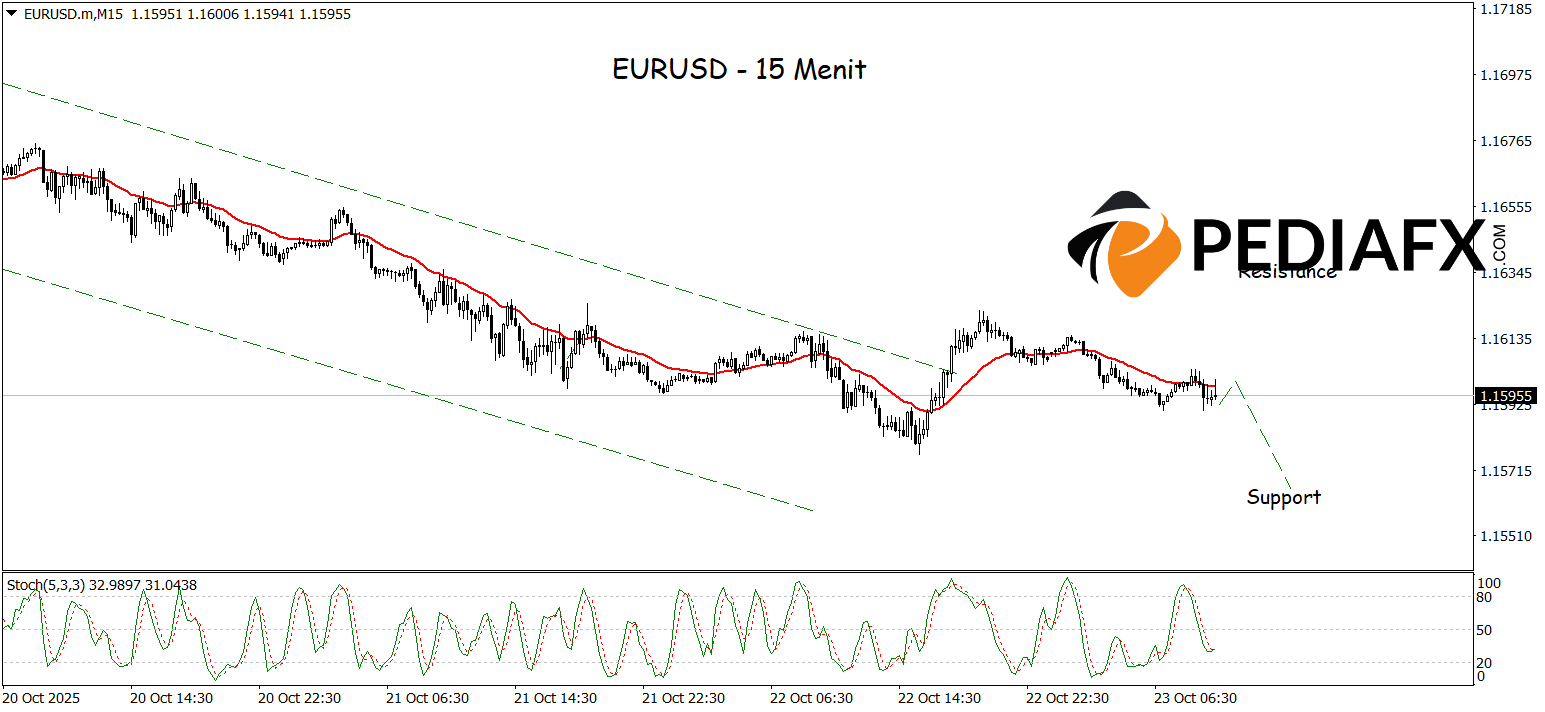
On the 15-minute timeframe, the established bearish channel further emphasizes the sellers’ dominance over the EURUSD movements. The sharply declining Moving Average (MA) indicates increasing selling pressure, while the Stochastic indicator, which has reversed down from the overbought zone, suggests that the bearish momentum is solidifying. With the support of these technical signals, the EURUSD pair is likely to continue its decline, aiming to test the critical support level around 1.15645 in the near term.
Technical Reference: sell below 1.16325
Potential Stop Loss 1: 1.16200
Potential Stop Loss 2: 1.16325
Potential Take Profit 1: 1.15760
Potential Take Profit 2: 1.15650


