


The EURUSD currency pair may encounter renewed pressure as a double top pattern (indicated by blue shading) has emerged on the 1-hour chart. This configuration is recognized as a reversal signal, potentially halting the prevailing upward trend and triggering a change in price direction. Additional confirmation can be observed from the zigzag indicator, which marks the resistance level, strengthening the likelihood that the price may struggle to penetrate this area. Under these circumstances, the market is beginning to exhibit signs of a transition from a bullish phase to a possible correction.
Moreover, the CCI indicator is providing negative signals after declining from the overbought territory, indicating a weakening upward momentum. Selling pressure may increase if the price fails to hold above the nearest support level. Should the double top pattern be confirmed with consistent downward movements, the chances of the EURUSD continuing its decline on the 1-hour chart will broaden. This situation shifts the market’s focus towards whether the current bearish pressure is sufficient to push the price lower.

Recommended

Recommended

Recommended

Recommended
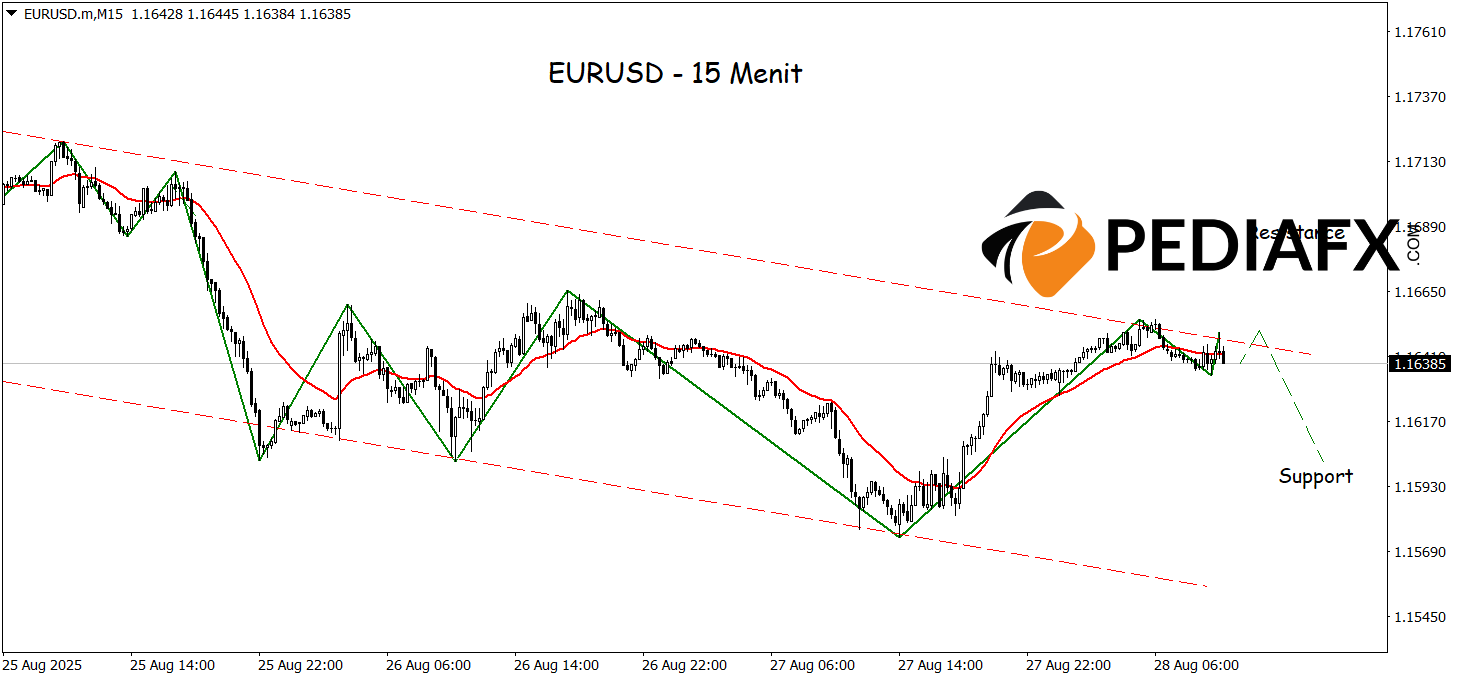
On the 15-minute time frame, EURUSD is seen moving within a bearish channel, which could apply further downward pressure on prices. The ZigZag indicator confirms the formation of a downward pattern, while the downward-sloping Moving Average (MA) line further enhances the bearish pressure. Given this context, EURUSD is poised to continue its decline and test crucial support levels around 1.16020.
Technical Reference: sell if below 1.16820
Potential Stop Loss 1: 1.16670
Potential Stop Loss 2: 1.16820
Potential Take Profit 1: 1.16195
Potential Take Profit 2: 1.16020








