

The Nasdaq has faced significant selling pressure after breaking below the lows of a bullish channel, confirming the emergence of a bearish pattern on the 1-hour chart. This movement illustrates the loss of control by the buyers, as the seller dominance grows stronger, pushing the prices downward. This technical structure serves as an important signal that a corrective trend is in progress and may continue in the near future.
The bearish signal is further supported by technical indicators. The sharply declining Moving Average (MA) reinforces the downward pressure, while the ZigZag pattern continuously creating new lower highs reaffirms the direction of weakness. With these combined factors, the Nasdaq is likely to continue its decline towards the next support area, indicating that movement in the European session this afternoon remains under the shadow of a bearish trend in the short term.
Recommended

Recommended

Recommended

Recommended
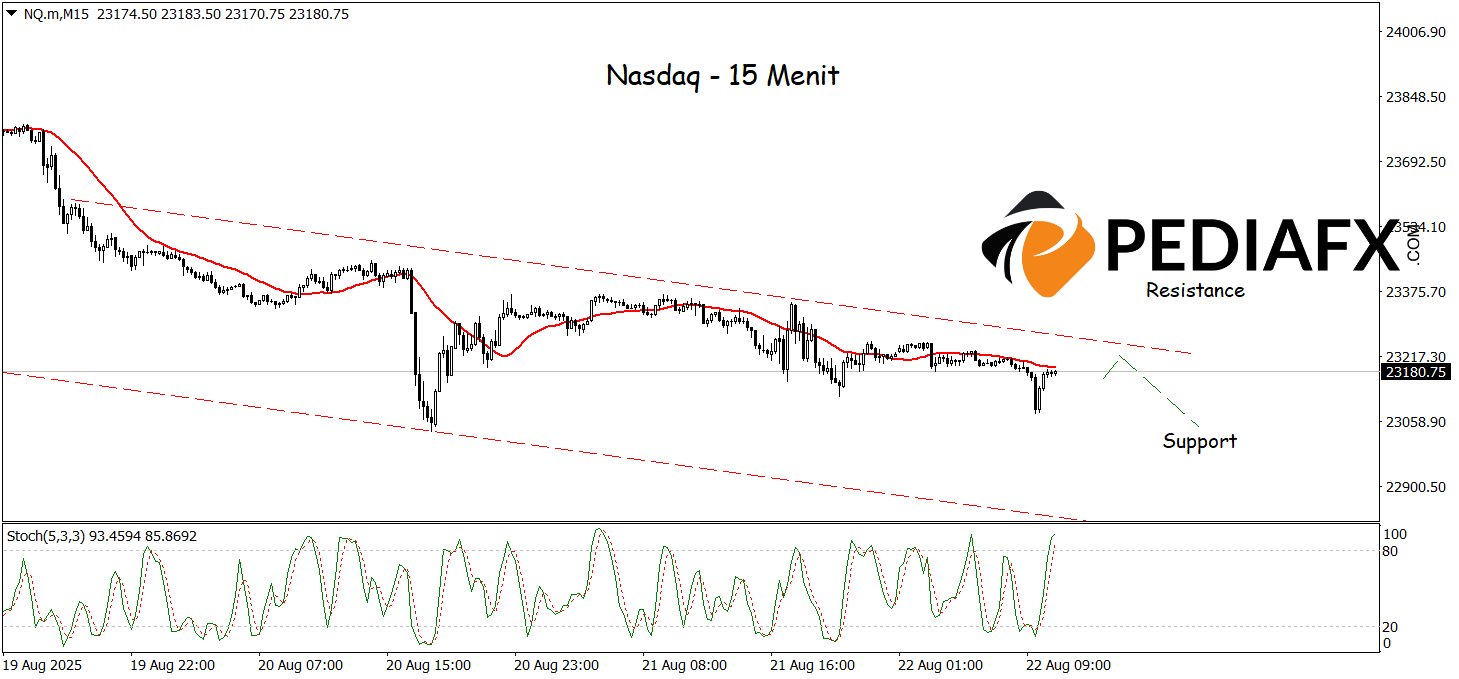
On the 15-minute timeframe, the Nasdaq increasingly confirms seller dominance after prices settled within a bearish channel, establishing a new low. This movement strengthens the signal that selling pressure still dominates the market. Meanwhile, the stochastic indicator, positioned in the overbought zone, also confirms the potential for continued weakening. With this technical support, the Nasdaq is poised to continue its downward trend, testing the crucial support level around 23,030.
Technical Reference: sell while below 23,343
Potential Stop Loss 1: 23,280
Potential Stop Loss 2: 23,343
Potential Take Profit 1: 23,090
Potential Take Profit 2: 23,030


