

The Nasdaq index is beginning to display signs of weakening, having formed a bearish channel on the hourly chart. The downward price structure combined with the declining Moving Average (MA) signals an initial indication that selling pressure is starting to dominate the market. Additionally, the ZigZag indicator reinforces this bearish signal with a consistent downward pattern, indicating a correction phase following a prior period of strengthening. This scenario suggests that market participants are taking a more cautious approach as they head towards the European session, with a tendency to await confirmation of the next direction.
From a momentum perspective, the CCI indicator, which is located in the overbought territory, adds to the signals that the upward movement is losing strength, thereby opening up the possibility of further corrections in the near term. If selling pressure continues, the Nasdaq could be poised to test the nearest support level before determining its subsequent direction. A failure to maintain price stability in this area could intensify the downturn, while a successful defense of the main support level may trigger a short-term technical rebound before a new trend takes shape.
Recommended

Recommended

Recommended

Recommended
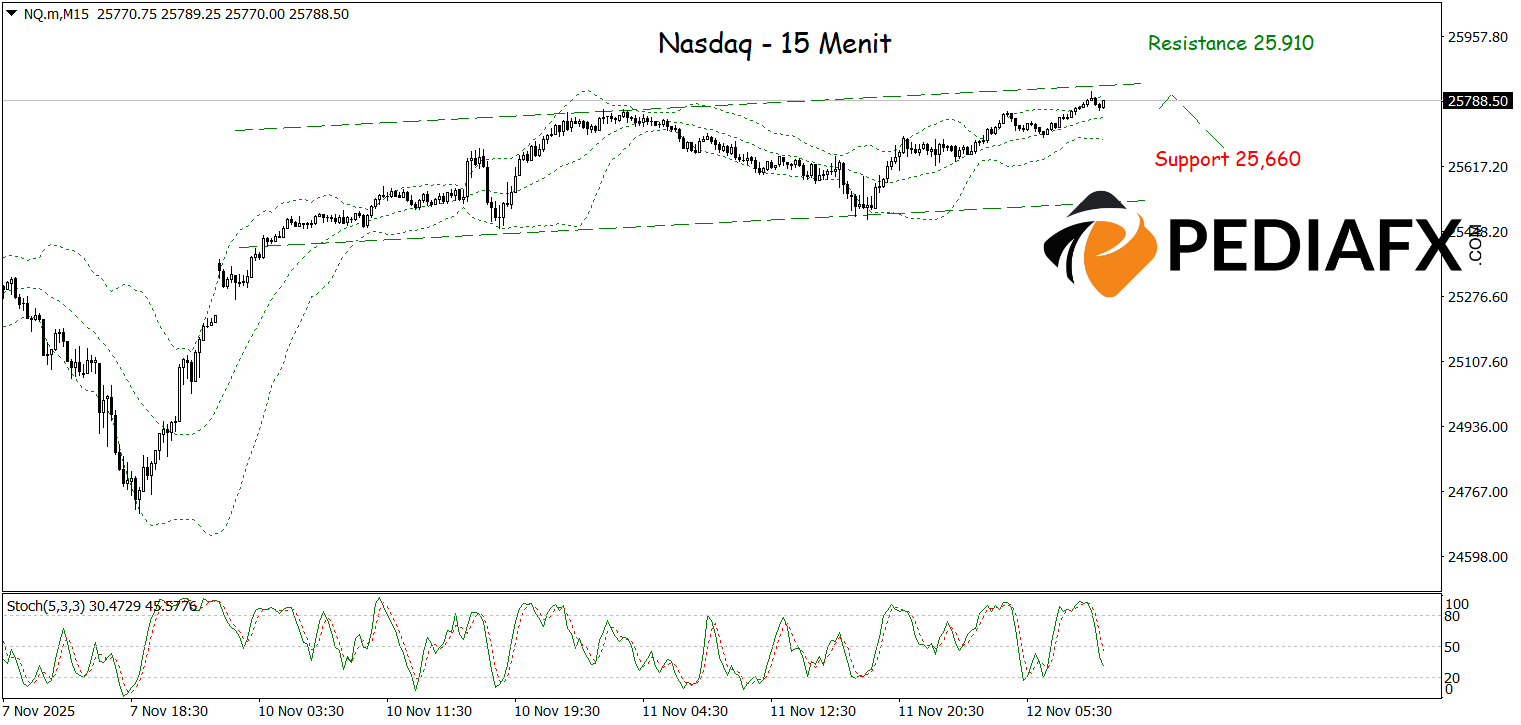
The Nasdaq indicates potential for a correction after encountering resistance at the upper boundary of the bullish channel, which coincides with the upper area of the Bollinger Bands (BB). The rejection at this level signifies that selling pressure has begun to emerge again after a previous strengthening phase. Furthermore, the Stochastic indicator, also situated in the overbought region, strengthens the potential short-term weakness signals. With this combination of technical indicators, the Nasdaq is on track to continue declining towards the support area of 25,660 in the near future.
Technical Reference: sell while below 25,910
Potential Stop Loss 1: 25,860
Potential Stop Loss 2: 25,910
Potential Take Profit 1: 25,710
Potential Take Profit 2: 25,660


