

The USDJPY pair is currently experiencing significant pressure, as three crucial technical indicators—ZigZag, Moving Average (MA), and MACD—concur on the potential for further decline. The ZigZag pattern has established a lower high and lower low, indicating a market trend that is now consistently moving downwards. Meanwhile, the MA line on the 1-hour timeframe is displaying a downward slope, with prices remaining below it, signaling the sellers’ dominance and a lack of short-term recovery strength.
In addition, the MACD indicator further corroborates the bearish outlook, as the MACD line sits below the signal line and the histogram displays increasingly deeper negative bars. This scenario reveals that selling momentum remains strong, with no convincing signs of a trend reversal. Given the alignment of these three technical signals, USDJPY is likely to continue its descent towards the next support level.
Recommended

Recommended

Recommended

Recommended
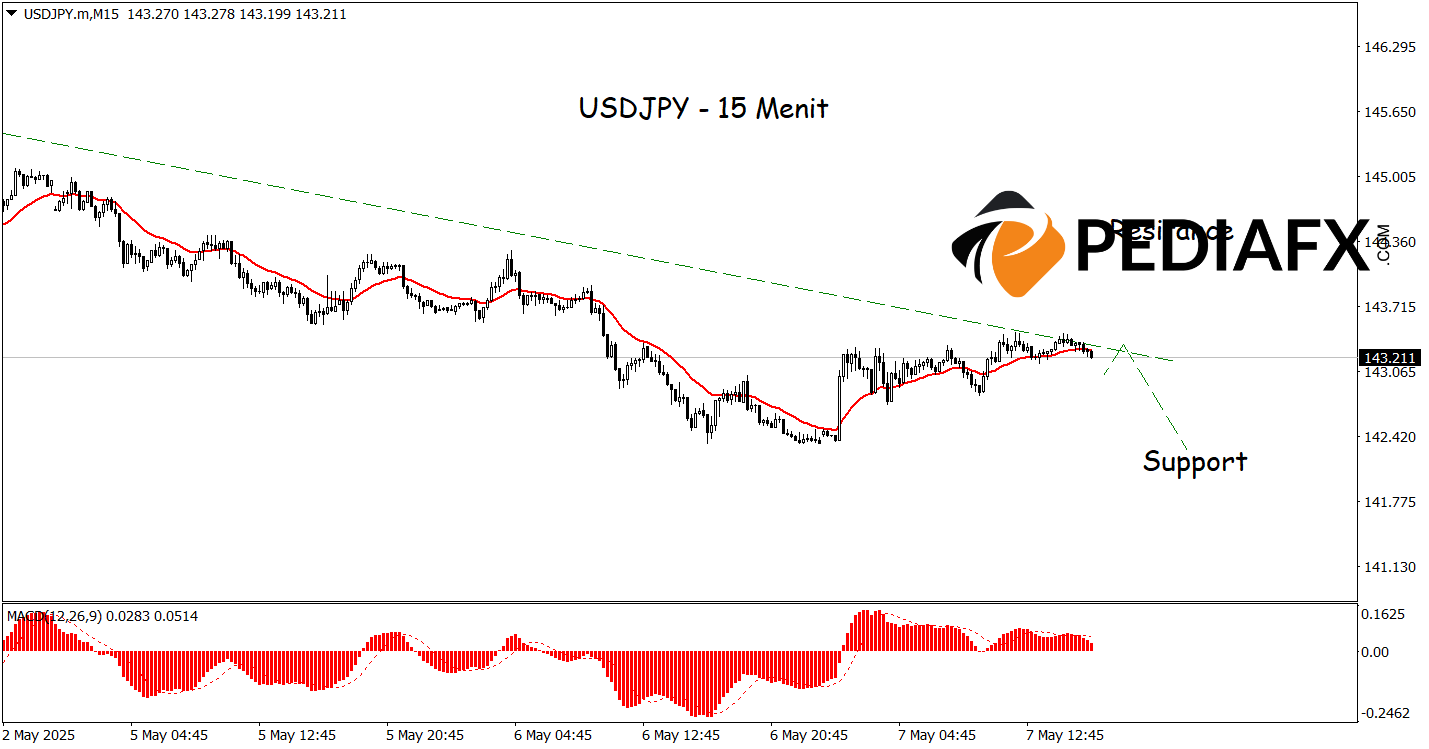
On the 15-minute chart, the currency pair shows a robust downward movement following the formation of a clear bearish trendline, indicating that prices are moving in a downward pattern. The Moving Average (MA) is currently trending downwards, reinforcing the signal that selling pressure is prevailing in the market. Additionally, the MACD indicator confirms the potential for decline, with the MACD line testing lower levels around 142.315.
Technical Reference: sell while below 144.320
Potential Stop Loss 1: 143.990
Potential Stop Loss 2: 144.320
Potential Take Profit 1: 142.585
Potential Take Profit 2: 142.315


