

In the 1-hour chart, GBPUSD continues to show potential for upward movement, maintaining a well-preserved uptrend structure. The consistent price action, forming higher highs and higher lows, reflects the ongoing strength of the buyers, who have yet to indicate any signs of weakness, with prices steadily following an upward trajectory. As long as this trend structure remains intact, selling pressure is deemed limited, which suggests that the likelihood of a short-term trend reversal is relatively low with the upcoming increase in market activity.
From a technical perspective, the bullish bias is strengthening further as the Moving Averages continue to trend upwards, and the ZigZag consistently forms an uptrend structure. Positive signals are also coming from the CCI indicator, which is in the oversold region, indicating potential buying momentum entering the market. This combination of indicators paves the way for GBPUSD to continue its ascent and test higher price areas as trading volatility increases.
Recommended

Recommended

Recommended

Recommended
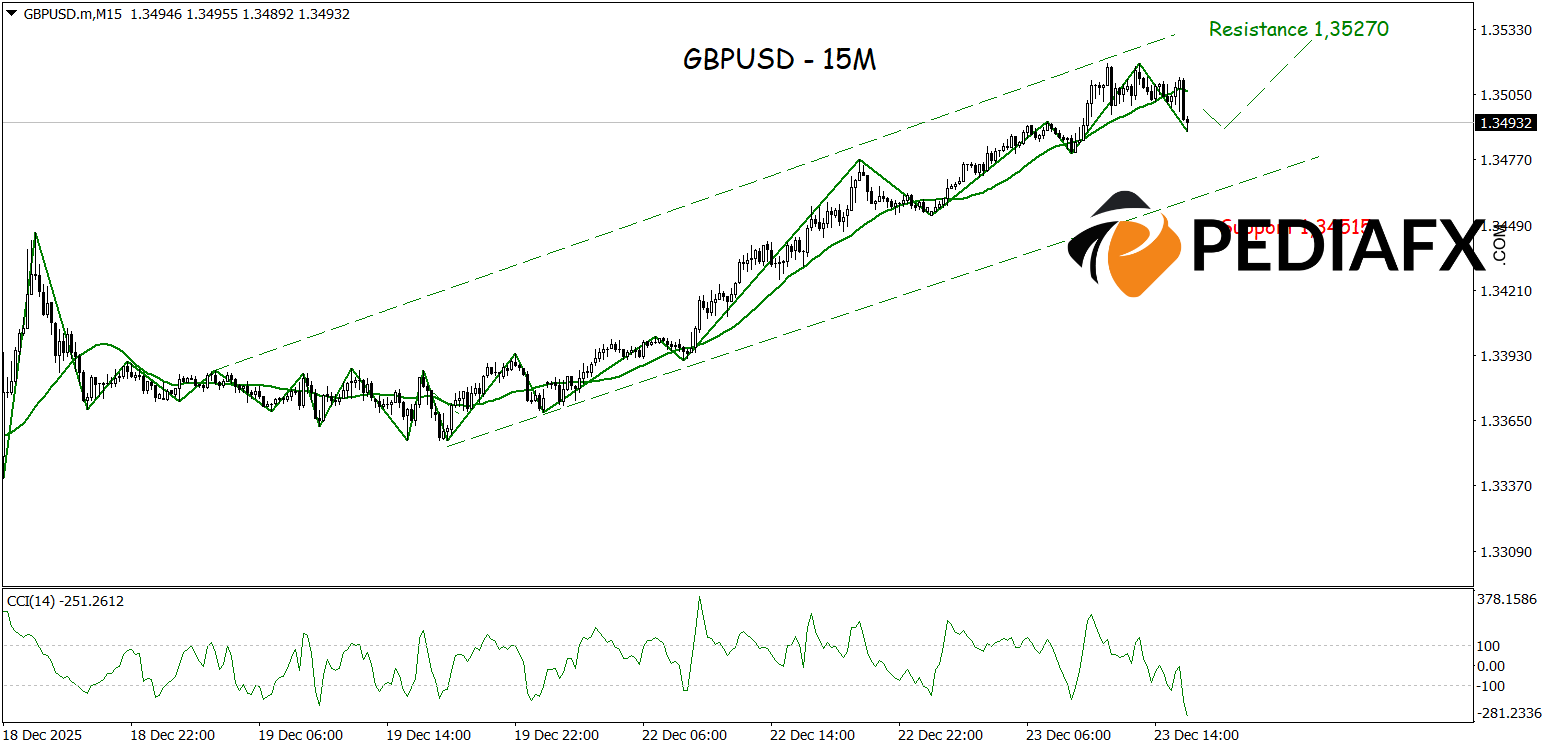
Meanwhile, on the 15-minute timeframe, GBPUSD also shows positive signals, with a structure of higher highs and higher lows still being consistent. The bullish ZigZag movement alongside the rising Moving Averages confirms that buyers continue to dominate intraday movements. With the CCI in the oversold region, GBPUSD has the potential to extend its gains and test the resistance level at 1.35270.
Technical Reference: buy as long as above 1.34515
Potential Take Profit 1: 1.35125
Potential Take Profit 2: 1.35270
Potential Stop Loss 1: 1.34665
Potential Stop Loss 2: 1.34515


