

The Nasdaq has reached new record highs, demonstrating the strong presence of buyers in the market. A consistent bullish structure is forming, indicating a continued potential for upward movement. This scenario reaffirms investor confidence in Nasdaq’s upward trend, resulting in a bullish bias that is increasingly evident on the hourly chart.
From a technical perspective, the bullish channel created by the zigzag pattern illustrates a steady upward progression. Additionally, the price’s position above the Moving Average (MA) reinforces the upward trend. The MACD indicator remaining in positive territory further enhances the belief that the Nasdaq’s bullish momentum remains strong. With this technical support, the opportunities for continued strengthening are wide open, and new all-time highs are likely within reach.
Recommended

Recommended

Recommended

Recommended
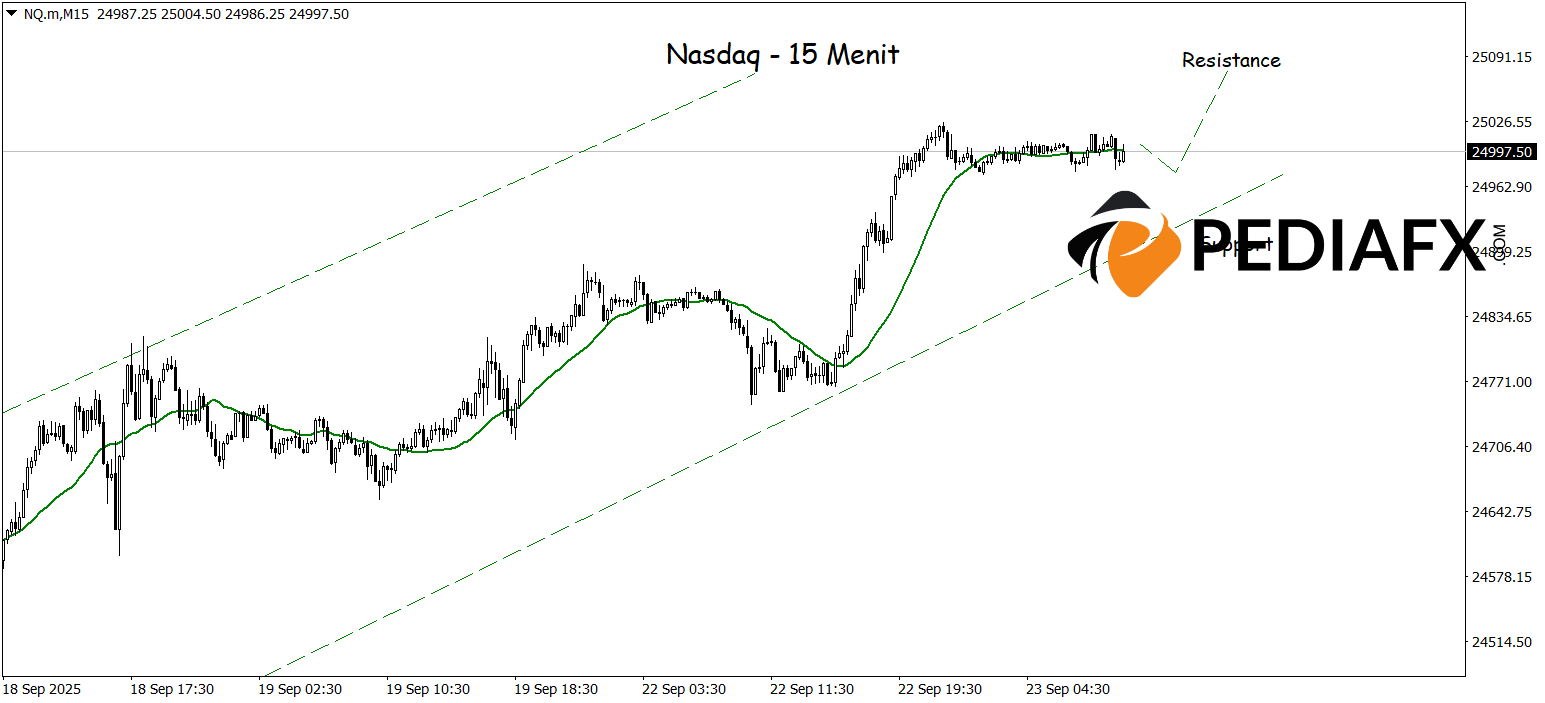
On the 15-minute chart, the Nasdaq displays significant bullish potential as the price stabilizes within an ascending channel, supported by a rising Moving Average (MA). This technical combination strengthens the short-term bullish signal, suggesting that the Nasdaq could continue its rally to test the critical resistance level at 25,080.
Technical Reference: buy while above 24,915
Potential Take Profit 1: 24,040
Potential Take Profit 2: 25,080
Potential Stop Loss 1: 24,947
Potential Stop Loss 2: 24,915


