

Although the overall trend of the Nasdaq on a 1-hour timeframe remains categorized as bullish, clear signs of a correction are beginning to appear through the formation of a minor bearish channel highlighted by the red diagonal lines on the price chart. This pattern indicates that after a robust upward phase, the index starts to exhibit signs of slowing momentum. The current price action, which is contained within this descending channel, suggests short-term selling pressure as market participants begin to take profits following the prior rally. This structure is an early signal that a potential downward correction is developing amidst an underlying positive trend.
From a technical standpoint, the Moving Average (MA) indicator has started to decline, and the ZigZag indicator shows a lower high pattern that reinforces short-term correction potential. Moreover, the Commodity Channel Index (CCI) is already in the overbought territory, further enhancing the likelihood of corrective pressure. This combination of signals implies that the Nasdaq could weaken temporarily before buyers reassert control. As long as the price remains within the bounds of the minor bearish channel, the possibility of a decline towards the nearest support area remains open before the main trend resumes its bullish trajectory.
Recommended

Recommended

Recommended

Recommended
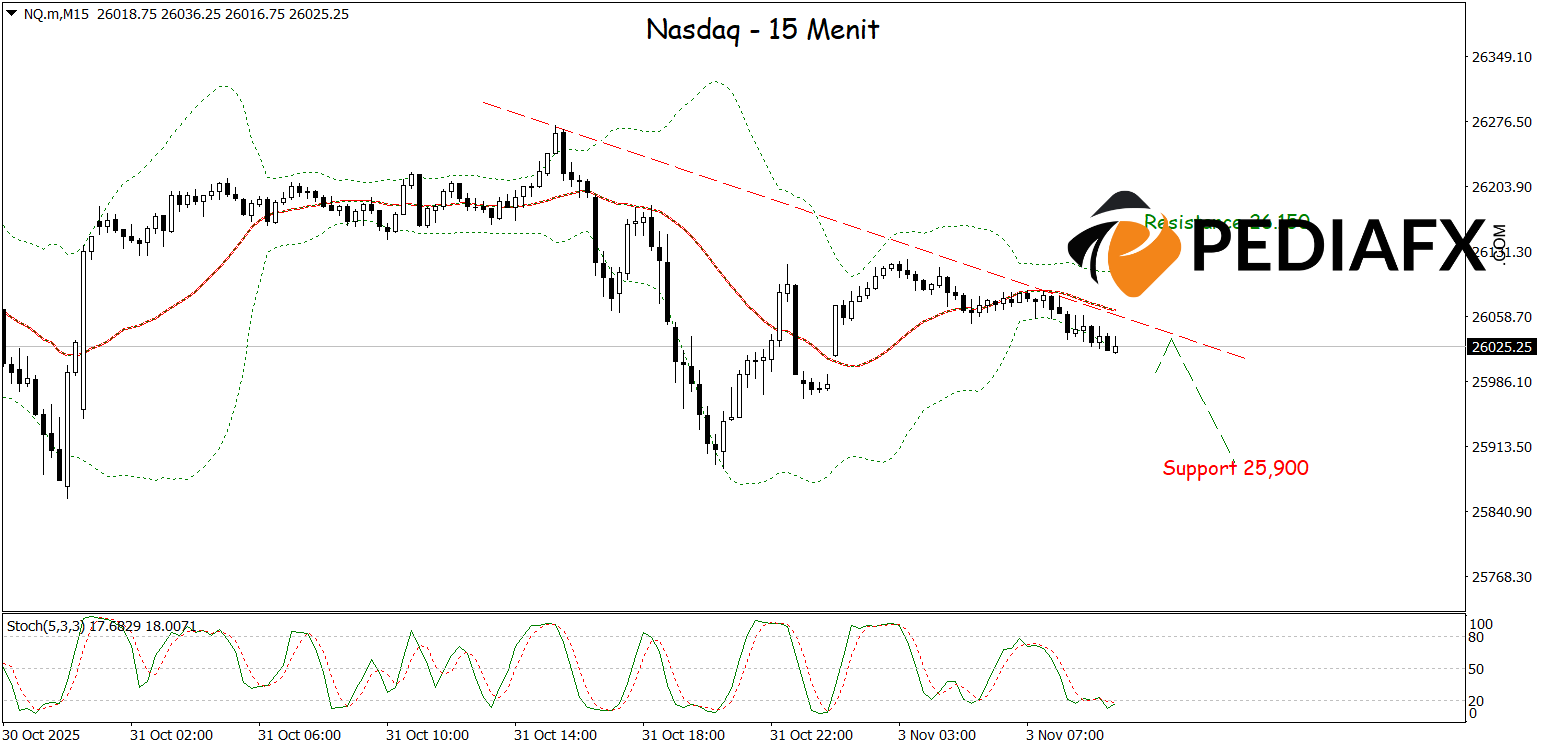
The Nasdaq demonstrates increasing bearish potential after the price has breached the support level of the Bollinger Bands (BB), indicating that selling pressure is starting to dominate. The declining direction of the Moving Average (MA) and the formation of a bearish trendline only strengthen this weakening signal. This condition indicates that downward momentum is developing, and as long as the seller pressure continues, the Nasdaq has the potential to further decline to test the support zone around 25,900 in the near future.
Technical Reference: sell when below 26,150
Potential Take Profit 1: 26,110
Potential Take Profit 2: 26,150
Potential Stop Loss 1: 25,940
Potential Stop Loss 2: 25,900


