

The price of Gold is beginning to exhibit signs of recovery after bouncing off the lower limit of the Bollinger Bands. This bounce often serves as an initial signal that selling pressure is subsiding, and opportunities for a bullish rebound are emerging.
Additional confirmation is provided by the MACD indicator, which is starting to show a bullish crossover. The MACD line is approaching or crossing above the signal line, indicating that buying momentum is on the rise.
Recommended

Recommended

Recommended

Recommended
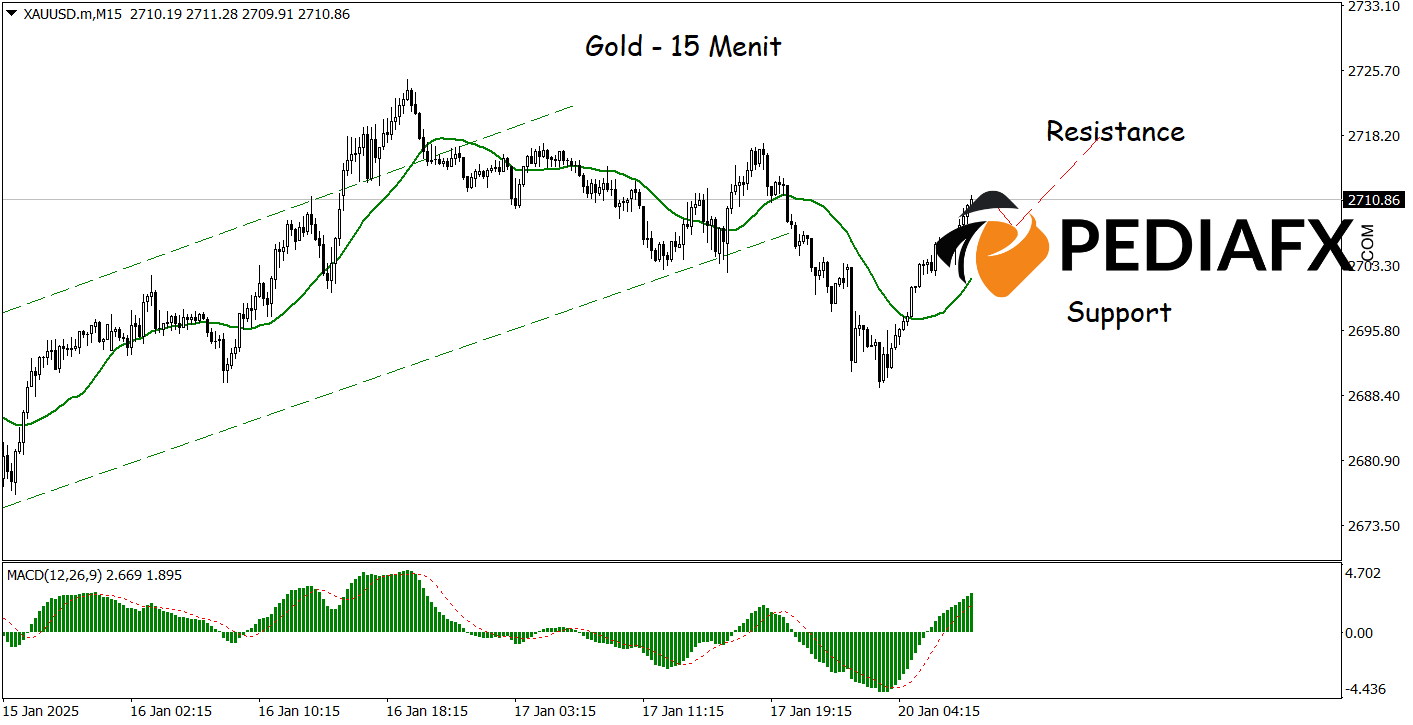
On the 15-minute chart above, Gold is showing initial signs of recovery after bouncing off the lower Bollinger Band. This bounce usually indicates that selling pressure is lessening, and the chance for a bullish rebound begins to open up. The MACD indicator notably shows bullish conditions, signaling an increase in buying momentum. If this scenario unfolds as expected, Gold prices could rise to the resistance level of $2,717.
Technical References: buy as long as it stays above 2,691.00
Potential Take Profit 1: 2,713.00
Potential Take Profit 2: 2,717.00
Potential Stop Loss 1: 2,705.00
Potential Stop Loss 2: 2,700.00


