

The Nasdaq index experienced significant downward pressure during the US session last night after prices breached the lower boundary of the bullish channel, indicating a loss of upward momentum that had previously supported the index. The sharp decline has created new lows, suggesting an increasing strength of sellers and a trend shift into the bearish zone.
The price structure on the 1-hour chart is now showing a clearer downward tendency, reinforced by rising profit-taking activity and market concerns regarding the growth prospects of the technology sector, which further dampens investor buying interest. From a technical perspective, the downward sloping Moving Average (MA) confirms the weakening of the short-term trend, while the ZigZag indicator consistently produces new lows, indicating that selling pressure remains intense.
Recommended

Recommended

Recommended

Recommended
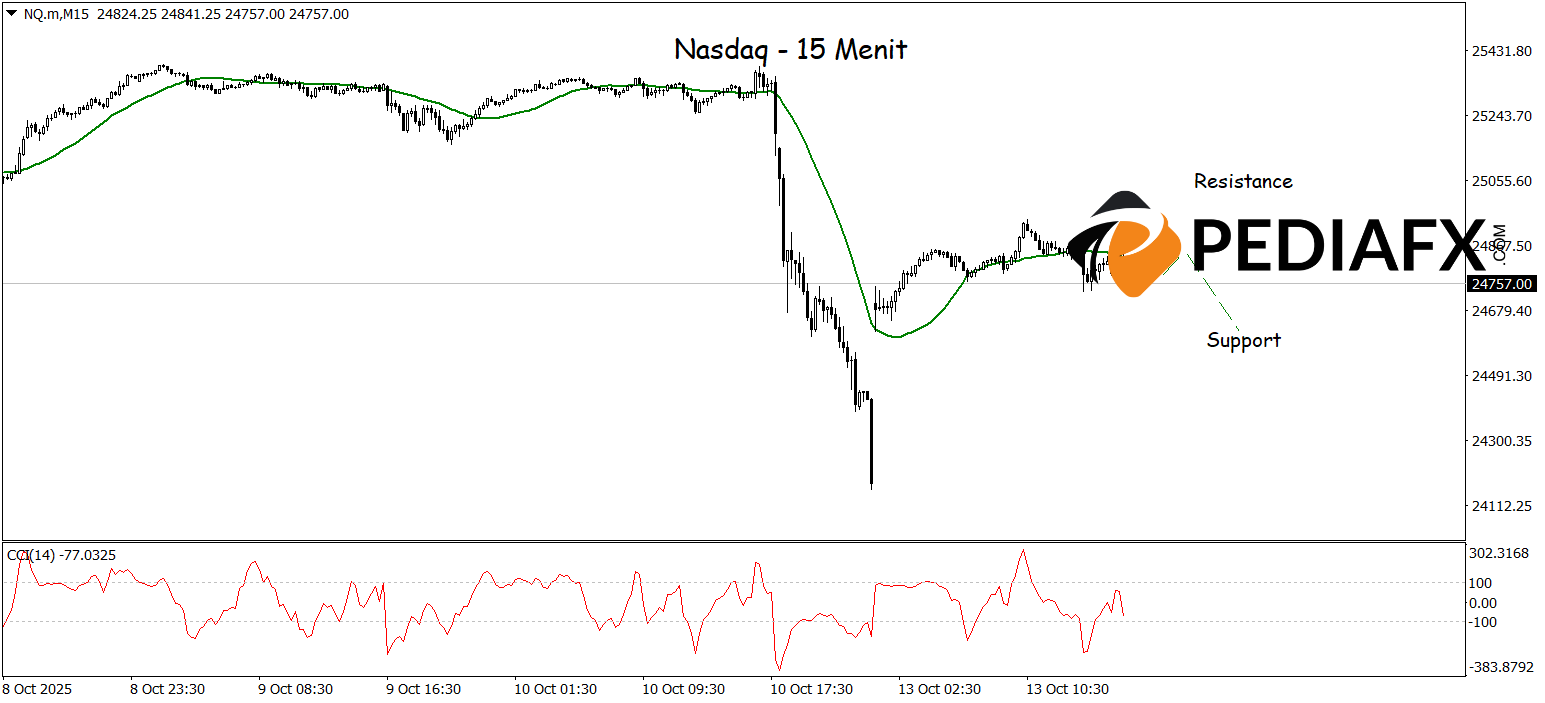
The combination of these signals reinforces the potential for continued decline, especially if prices fail to return above the recently breached support zone. Additionally, on the 15-minute chart, the flattening MA and the CCI moving out of the overbought area further emphasize the chances for a short-term correction still remain. Should selling pressure persist, the Nasdaq could continue to weaken, potentially testing the support area around 24,613 in the near term.
Technical Reference: sell while below 25,022
Potential Stop Loss 1: 24,955
Potential Stop Loss 2: 25,022
Potential Take Profit 1: 24,697
Potential Take Profit 2: 24,613


