

The USDJPY pair is once again showcasing signs of recovery following a sharp correction from its previous peak. The bullish trend structure, indicated by the patterns of Higher High (HH) and Higher Low (HL), remains intact despite experiencing selling pressure in the upper channel area. Currently, the price has successfully broken above a minor resistance after clearing a short consolidation phase. The price reaction emerging from the downward pressure indicates a potential return of buyer dominance, especially as the price starts to move back above the middle Bollinger Bands line along with the EMA beginning to curve upwards.
From an indicator perspective, the CCI (Commodity Channel Index) has surged above the +200 level, indicating a robust bullish momentum after previously being in the oversold zone. If the price can maintain its position above the breakout level, there is a chance for further upward progression towards the upper channel resistance area, continuing the HH-HL pattern that has been forming since mid-June. With the strengthening technical support, USDJPY could regain buying interest, particularly if market sentiment towards the US dollar remains positive in the upcoming sessions.
Recommended

Recommended

Recommended

Recommended
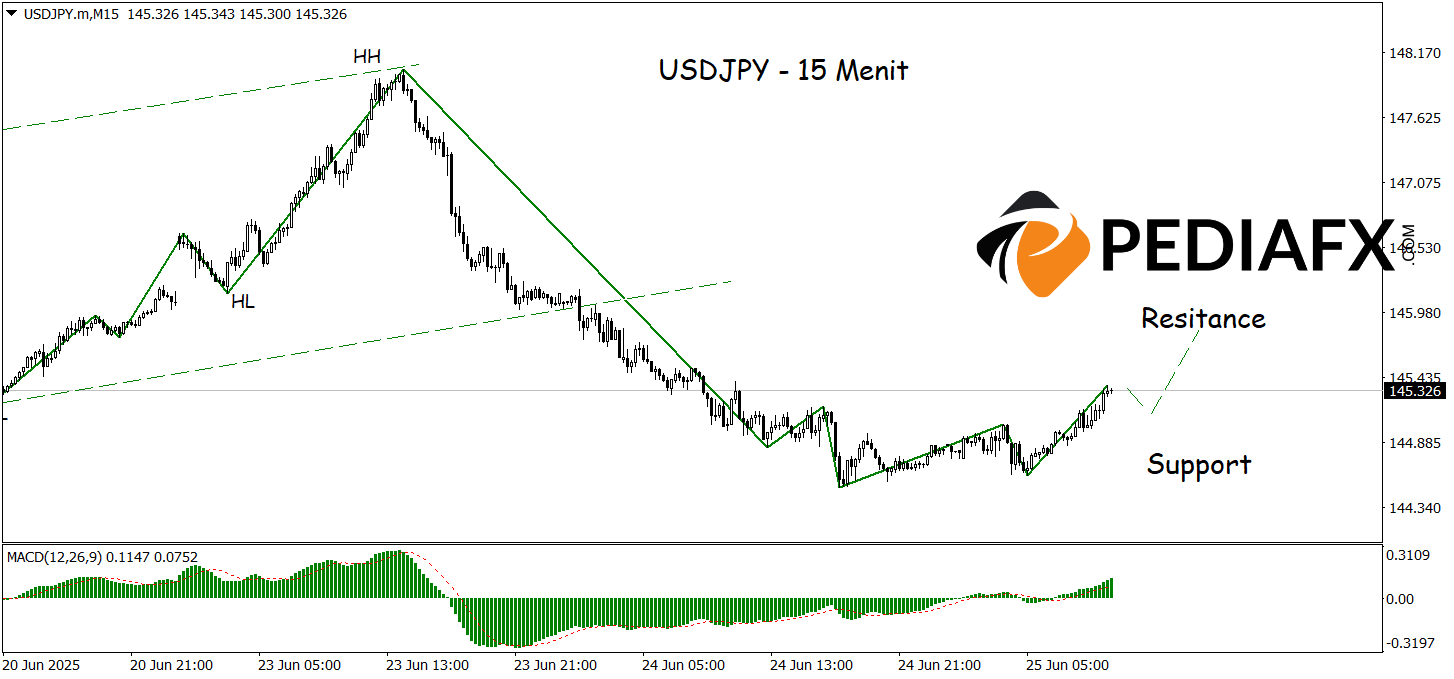
On the 15-minute time frame, USDJPY is starting to show signs of recovery after a prolonged correction phase from its previous price peak (Higher High). The price is currently moving upwards towards a resistance level that may pose a temporary obstacle, while a new support level is beginning to form, serving as a basis for price movement. The MACD indicator is strengthening and starting to enter positive territory, signaling the emergence of early bullish momentum. If the price can hold above the support and breach the nearest resistance at 145.825.
Technical Reference: buy as long as it stays above 144.780
Potential Take Profit 1: 145.635
Potential Take Profit 2: 145.825
Potential Stop Loss 1: 144.955
Potential Stop Loss 2: 144.780


