

The Nasdaq index on the 1-hour chart continues to operate within a robust bullish channel, indicating that the strength of the buyers remains prominent in the market. The formation of Higher Low (HL) and Higher High (HH) patterns, confirmed by the ZigZag indicator, illustrates that the upward trend is still intact. This movement hints that buyers still have control, ensuring a prevailing bullish bias in light of the market’s dynamics.
Technical support is also indicated by the upward trajectory of the Moving Average (MA) and a positive MACD, showing that the upward momentum hasn’t faded. This combination of signals reinforces the potential for continued rallies, where the Nasdaq may test or even surpass the nearest resistance level. As long as the price remains within the bullish channel and indicators remain aligned with the upward trend, the short-term bullish scenario is expected to persist.
Recommended

Recommended

Recommended

Recommended
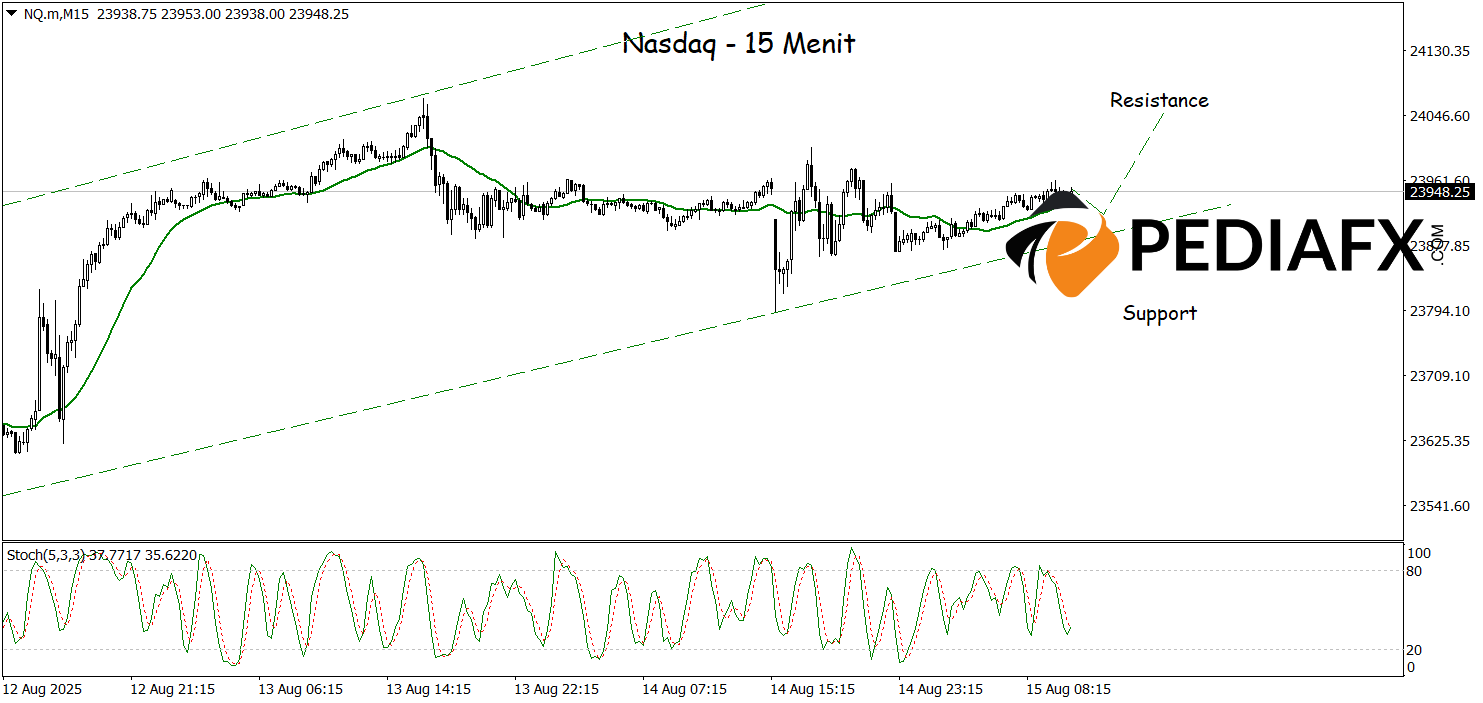
On the 15-minute chart, the Nasdaq is still navigating within a bullish channel, with the MA showing a tendency to rise, despite beginning to flatten out. Simultaneously, the Stochastic indicator, positioned in the oversold area, provides additional impetus for strengthening, creating opportunities for the Nasdaq to test resistance around 23,962.
Technical References: buy while above 23,835
Potential Take Profit 1: 24,017
Potential Take Profit 2: 24,048
Potential Stop Loss 1: 23,870
Potential Stop Loss 2: 23,836


