

A bullish channel apparent on the hourly chart indicates a strong signal that the Nasdaq is likely to continue its upward momentum. The price structure consistently moving within the ascending channel signifies that buyers are maintaining control of the market. Additionally, the zigzag indicator illustrates a steady upward trend pattern, reinforcing the positive outlook for the Nasdaq in the short term. This technical factor creates opportunities for the index to extend its rally and potentially break through the nearest resistance level.
Further support comes from the zigzag movements that are still trending upward, adding to the confidence that the bullish trend shows no signs of weakening. As long as prices stay above the lower boundary of the channel, the Nasdaq’s outlook remains tilted toward growth. With the combination of the bullish channel pattern and upward zigzag, the chances for the Nasdaq to prolong its positive momentum are increasing, suggesting potential tests of higher levels in the near future.
Recommended

Recommended

Recommended

Recommended
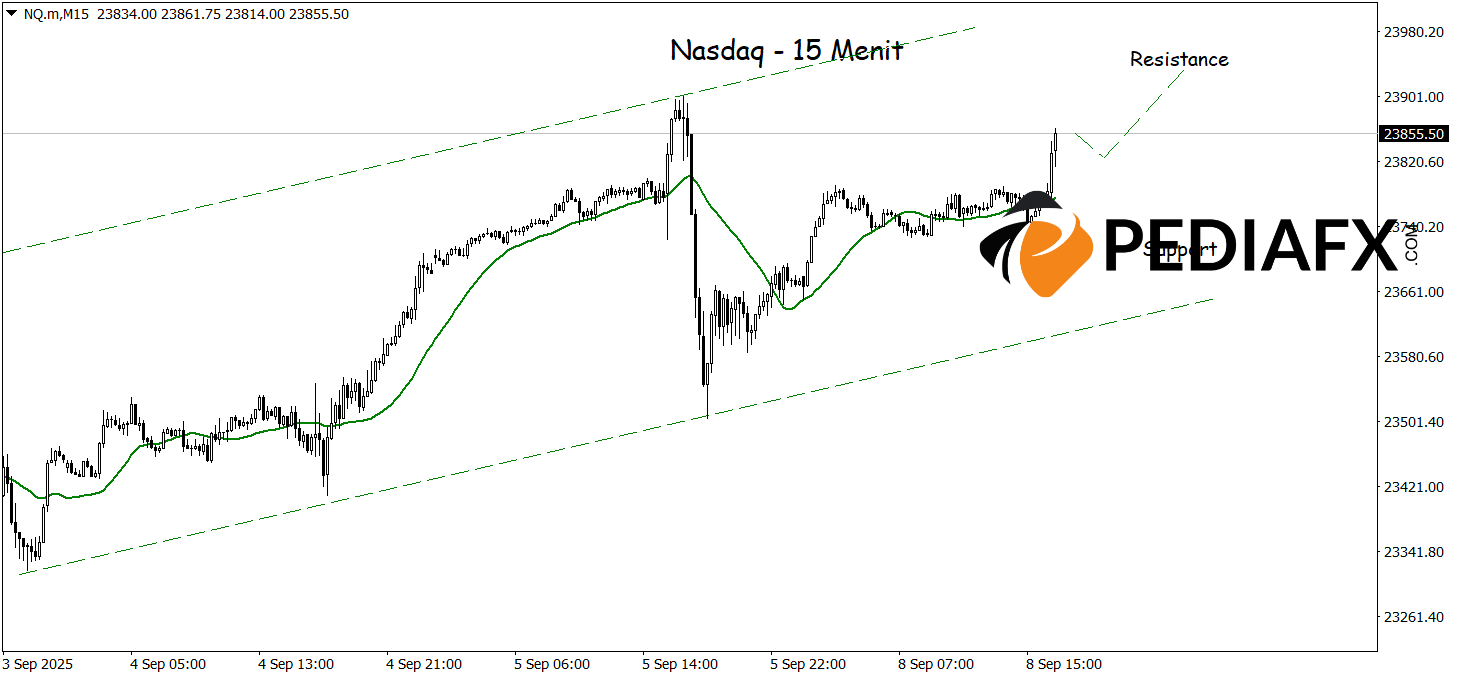
On the 15-minute chart, the established bullish channel for the Nasdaq reveals escalating potential for increases, bolstered by the Moving Average (MA) movement, which, while flat, is still trending upward. This technical condition strengthens buyer dominance, paving the way for the Nasdaq to continue its short-term rally and possibly test the nearest resistance area around the 23,935 level.
Technical Reference: buy if above 23,720
Potential Take Profit 1: 23,895
Potential Take Profit 2: 23,935
Potential Stop Loss 1: 23,762
Potential Stop Loss 2: 23,720


