

The Nasdaq is starting to exhibit signs of weakness after a breakout from the lower area of the bullish channel and is forming new lows on the 1-hour chart. Following this decline, the price appears to be pulling back to the previous breakout area, establishing a Support Become Resistance (SBR) pattern — a classic signal indicating the potential continuation of a bearish trend. This pattern shows that buyers have failed to maintain upward momentum, while sellers are beginning to take control of price direction in the market.
From a technical perspective, both the ZigZag indicator and Moving Average (MA) confirm a consistent downward direction. The price structure moving beneath the MA further strengthens the suspicion that the Nasdaq is poised to continue its downward pressure in the near term. As long as the price remains below the SBR area and no significant reversal signals emerge, the bearish trend is likely to persist, with a target decline toward the next support area.
Recommended

Recommended

Recommended

Recommended
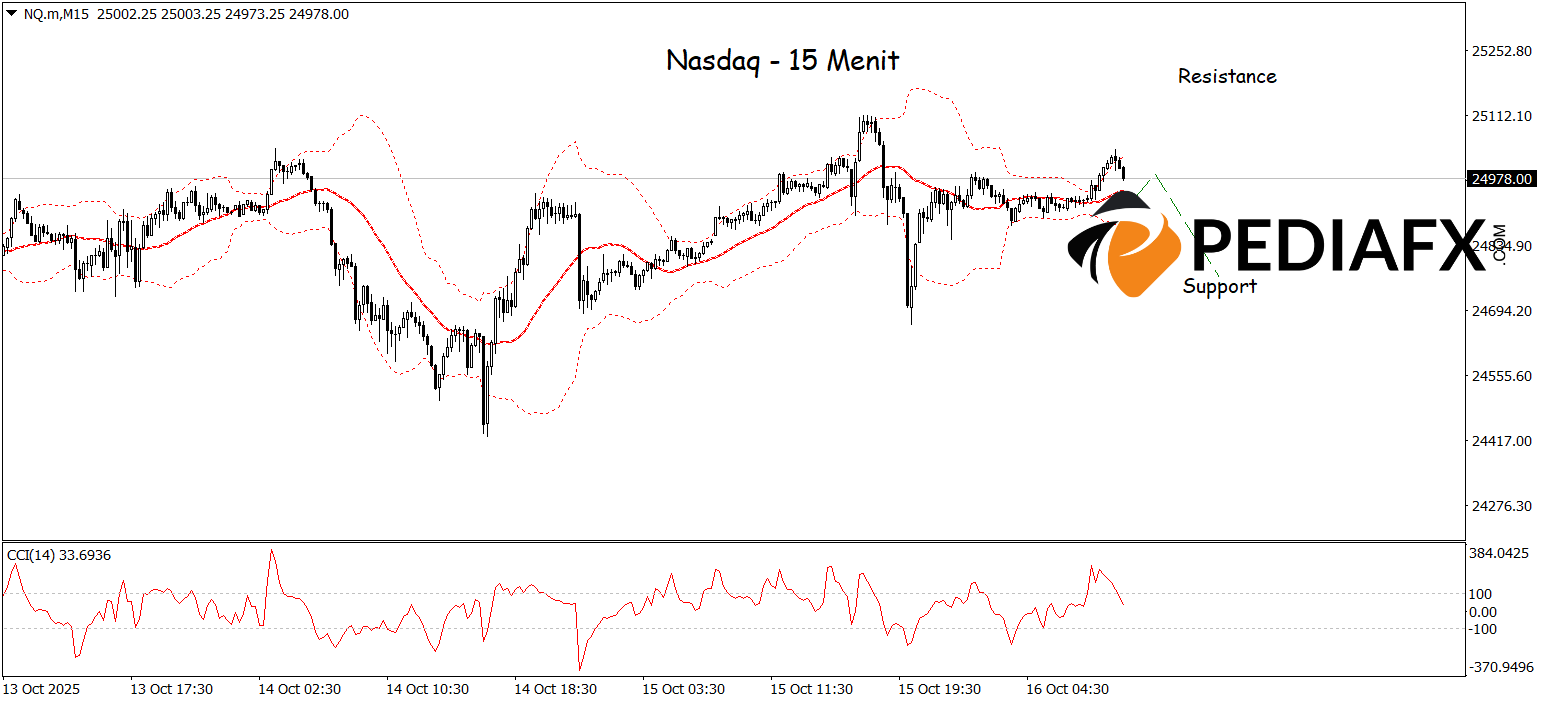
The Nasdaq exhibits potential weakness after the price struggled to stay at the resistance level of the Bollinger Bands (BB) and has started to trend downward. Selling pressure is intensifying as the CCI indicator falls from the overbought area, signaling a weakening upward momentum and an increase in seller dominance. Given these technical conditions, the Nasdaq may continue to decline and test the crucial support level around 24,835 shortly.
Technical Reference: Sell if below 25,175
Potential Take Profit 1: 25,115
Potential Take Profit 2: 25,175
Potential Stop Loss 1: 24,830
Potential Stop Loss 2: 24,772


