

The price of Gold on the 1-hour chart is beginning to exhibit signs of a direction reversal after successfully breaking through the bearish trendline that had previously hindered the downward movement of prices. This structural change in price action is further supported by the Moving Average (MA), which is starting to cross into a bullish alignment, indicating a potential shift in momentum from selling pressure to buying pressure. Additionally, the zigzag pattern indicates the possibility of forming a new swing low that is higher than before, reinforcing the notion that Gold is starting to establish a base for a short-term uptrend.
From the perspective of momentum indicators, the MACD is now in the positive territory, providing an additional signal that buying strength is beginning to dominate the market. If this trend continues, Gold is likely to continue its ascent towards the nearest resistance level, which is a crucial area to test the consistency of this new trend. As long as the price remains above the area of the break trendline and the MA continues to trend upwards, the opportunity for Gold to sustain a bullish movement will remain wide open.
Recommended

Recommended

Recommended

Recommended
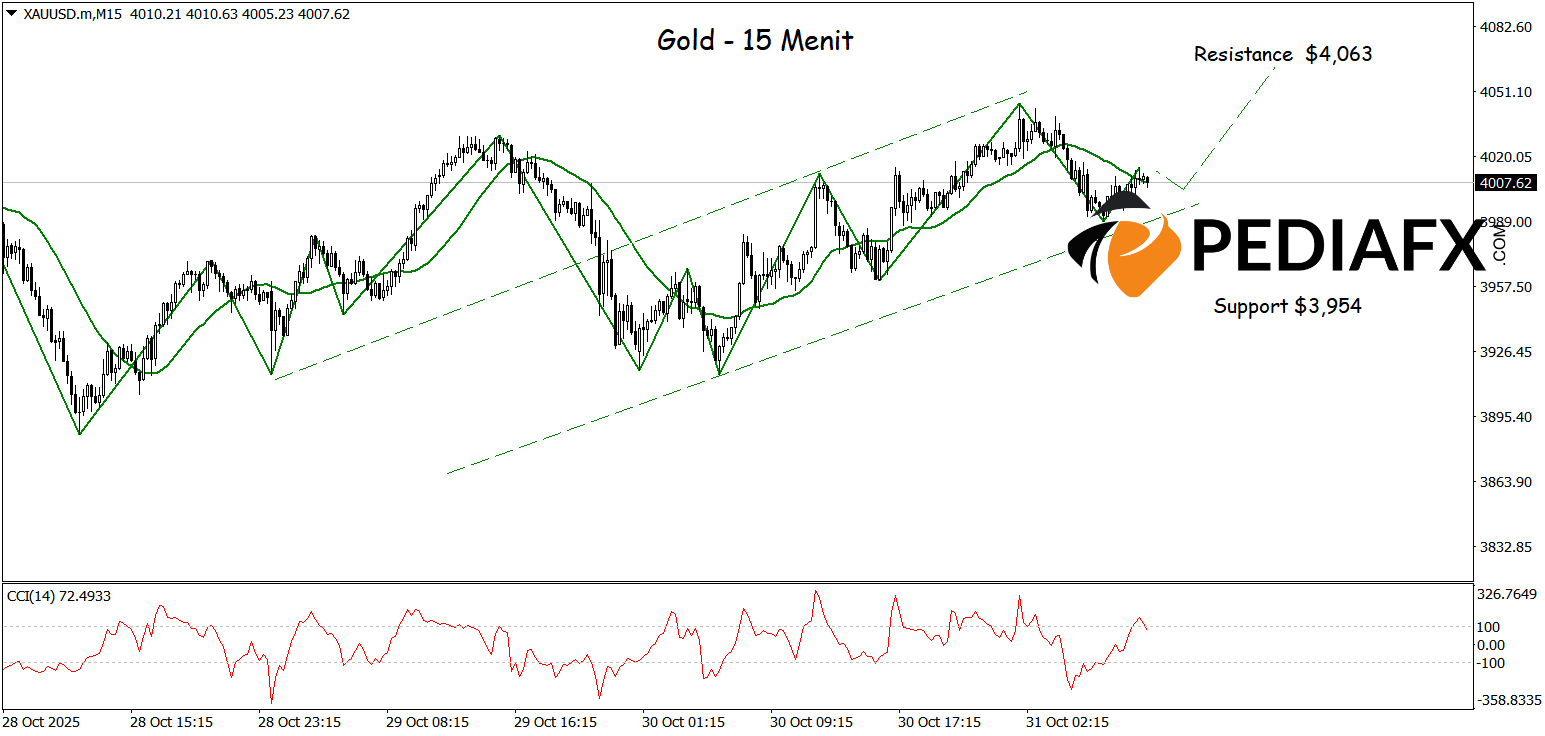
On the 15-minute chart, a bullish channel is beginning to form, signaling a solidifying upward momentum in Gold’s movement. The zigzag pattern that continues to print swing highs and higher swing lows reflects a trend now dominated by buying strength. Meanwhile, the Moving Average (MA) that has crossed into the bullish region further enhances the potential for continued price increases. With this combination of technical signals, Gold has the potential to maintain its positive movement and is preparing to test the significant resistance area at $4,063, which is a key level to determine whether this bullish momentum can extend further.
Technical Reference: buy while above 3,954
Potential Take Profit 1: 4,044
Potential Take Profit 2: 4,063
Potential Stop Loss 1: 3,972
Potential Stop Loss 2: 3,954


