

The movement of USDJPY on the 1-hour time frame shows signs of a weakening upward trend as prices break through the lower boundary of the bullish channel that has limited price movements since late May. The previous market structure, characterized by Higher Highs (HH) and Higher Lows (HL), is now disrupted, indicated by the price’s failure to maintain its position within that channel. Increased selling pressure has caused USDJPY to drop below the dynamic support, and the MACD indicator also confirms the negative momentum, with the histogram extending deeper into the negative territory.
This break in the trend may signal an initial indication that buyer dominance is starting to weaken, and the potential for a trend reversal is increasingly open. As long as prices remain below the former support now turned resistance, the opportunity for further corrections remains significant as it heads towards the next zone of support.
Recommended

Recommended

Recommended

Recommended
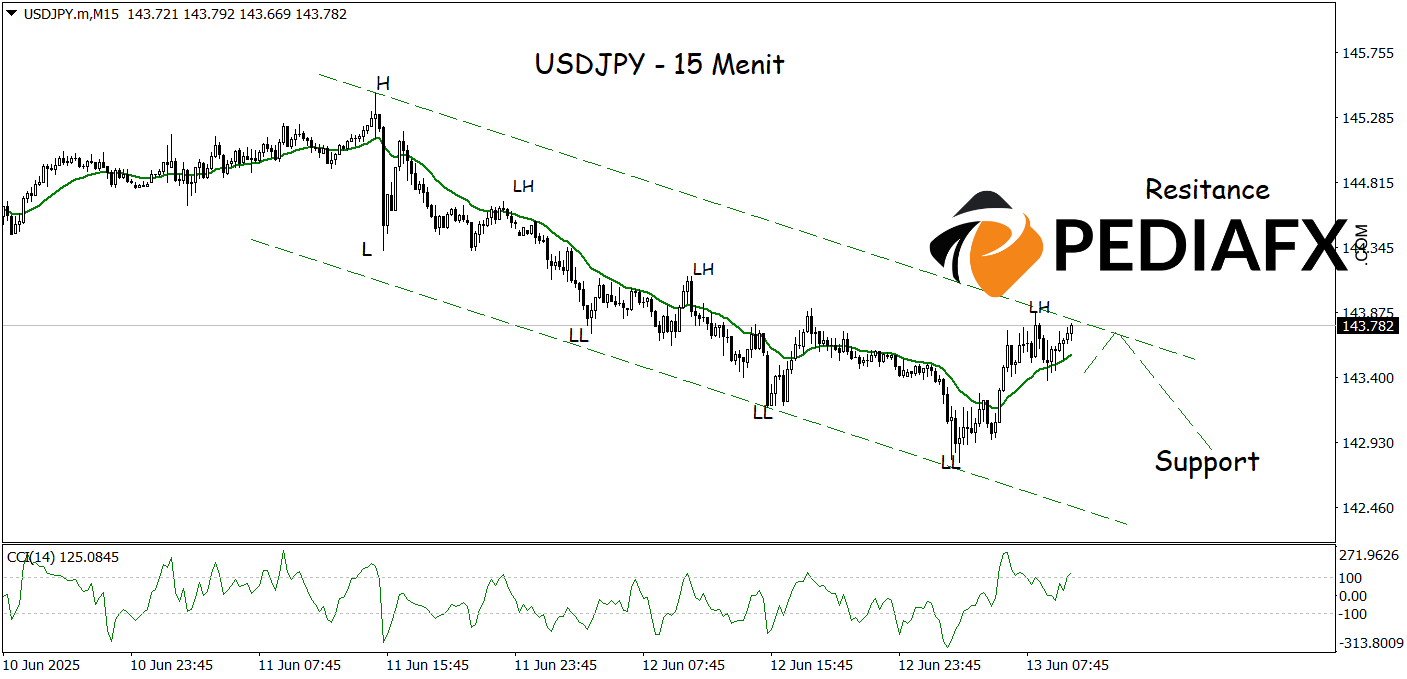
The USDJPY on the 15-minute time frame is moving within a maintained bearish channel, indicating that selling pressure remains dominant in the short term. The CCI indicator, which was previously in the overbought territory, is now starting to decline, providing an early signal that corrective downward momentum is becoming active once again. While prices stay beneath the upper line of the channel and do not breach the nearest resistance, the potential for further declines remains in play, targeting support at 142.880.
Technical Reference: Sell while below 144.340
Potential Stop Loss 1: 144.345
Potential Stop Loss 2: 144.650
Potential Take Profit 1: 143.155
Potential Take Profit 2: 142.880


