

According to the technical analysis for the USDJPY currency pair within the 1-hour timeframe, indications of a trend reversal are present after prices were unable to maintain their position in an upward channel. A breakout occurred below the channel’s support line, which was subsequently followed by the emergence of a lower high (LH) and a lower low (LL), signaling an initial weakness in the previous bullish trend. The previously supportive blue area has now converted into resistance after the price executed a pullback, reinforcing the confirmation that selling pressure is currently dominating price movements.
Supporting this bearish scenario is also visible through the red Moving Average indicator, which has begun to curve downward, suggesting potential downward pressure in the short term. Additionally, the CCI indicator, which had previously entered the overbought territory, is now declining towards neutral territory, signaling a weakening in buying momentum. As long as prices remain below the pullback zone without breaking above it, the chances of further declines towards the next support level remain significant.
Recommended

Recommended

Recommended

Recommended
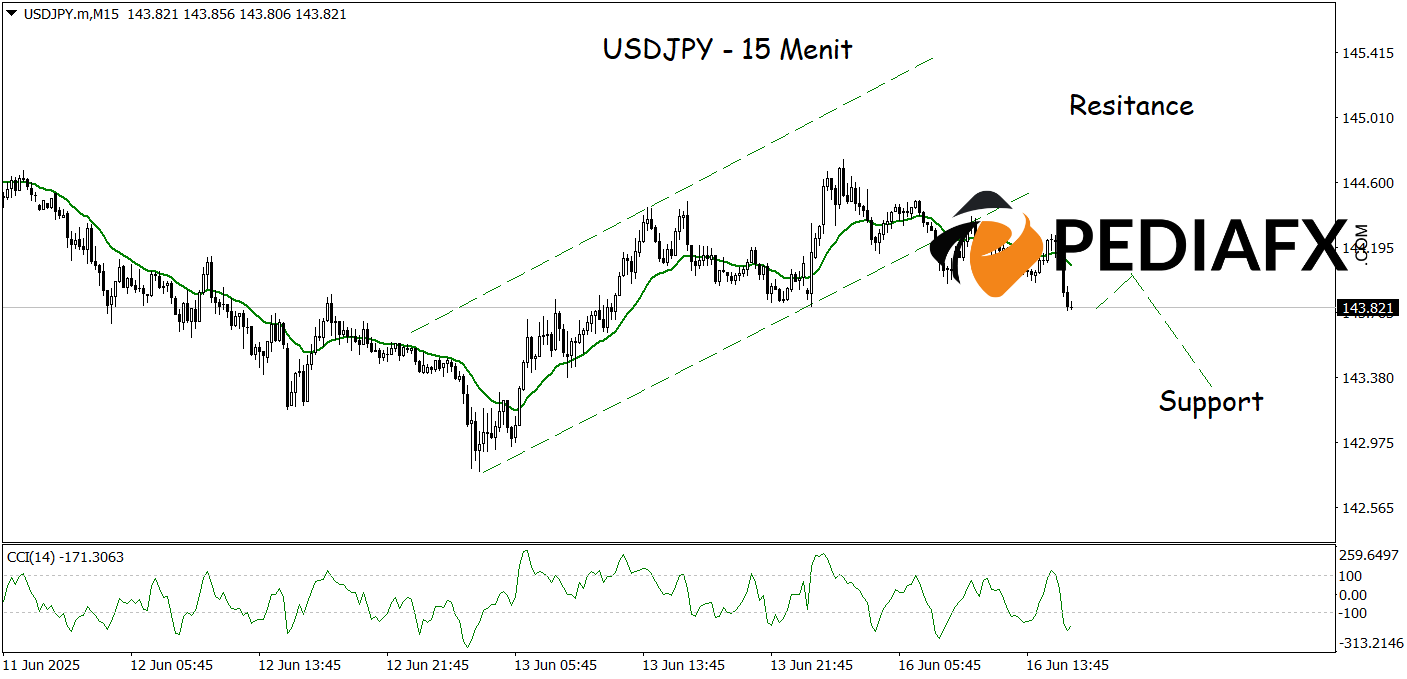
USDJPY indicates signs of potential weakness after breaking below the bullish channel on the 15-minute timeframe, signifying a shift in momentum from an uptrend to a corrective trend. Additional pressure is illustrated by the CCI indicator, currently situated in the overbought area, increasing the chances of a price reversal in the near future. As long as prices remain beneath the breached channel zone, the bearish scenario continues to prevail with a downward target of 143.325.
Technical Reference: sell while below 144.375
Potential Stop Loss 1: 144.155
Potential Stop Loss 2: 144.375
Potential Take Profit 1: 143.525
Potential Take Profit 2: 143.325


