

The USDJPY pair on the 1-hour time frame indicates a pronounced downward pressure following its inability to maintain upward momentum after breaching the resistance level. Instead of sustaining a bullish trend, the price has reversed, weakening and breaking below the upward trendline, signaling a shift in short-term movement. This scenario reflects a diminishing control by buyers, while selling pressure gradually takes over the market.
From a technical standpoint, the bearish signal is reinforced by a ZigZag pattern that forms a descending structure, along with a Moving Average that is beginning to trend downward. This combination of indicators confirms that the weakening momentum is still intact, opening the possibility for USDJPY to further decline towards the next support zone, provided that a strong pullback does not occur to push prices back above the breached trendline.
Recommended

Recommended

Recommended

Recommended
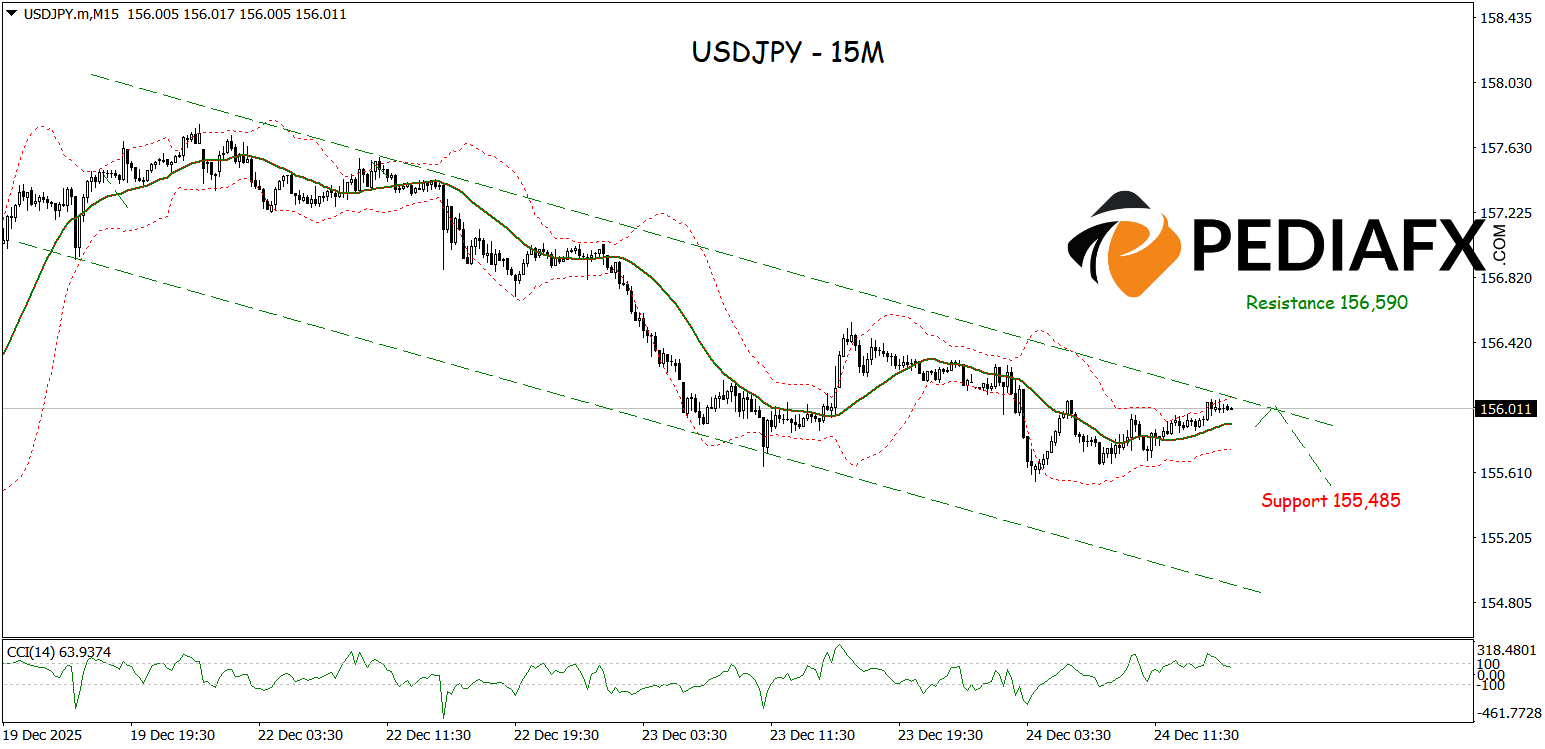
On the 15-minute chart, USDJPY is moving within a bearish channel, reflecting the dominance of selling pressure in the short term. The price rejection from the Bollinger Bands’ resistance area indicates that buying interest remains limited, while sellers continue to dominate the price movement. As long as the price remains below this resistance area, USDJPY has the potential to continue its decline to test the support level around 155.485.
Technical Reference: Sell below 156.590
Potential Take Profit 1: 156.355
Potential Take Profit 2: 156.590
Potential Stop Loss 1: 155.670
Potential Stop Loss 2: 155.485


