

The Nasdaq has faced significant selling pressure after breaking below the lower bounds of a bullish channel, confirming the establishment of a bearish pattern on the hourly chart. This movement signals a loss of control among buyers, with sellers increasingly dominating and pushing prices lower. This technical structure serves as an important indication that a correction trend is underway and may continue in the near future.
Bearish signals are further supported by technical indicators. The sharply declining Moving Average (MA) intensifies downward pressure, while the ZigZag pattern consistently marking new lower points emphasizes the weakening trend. With these combined factors, the Nasdaq could continue to decline towards the next support zone, suggesting that movements during the US trading session tonight will remain under the influence of a bearish trend in the short term.
Recommended

Recommended

Recommended

Recommended
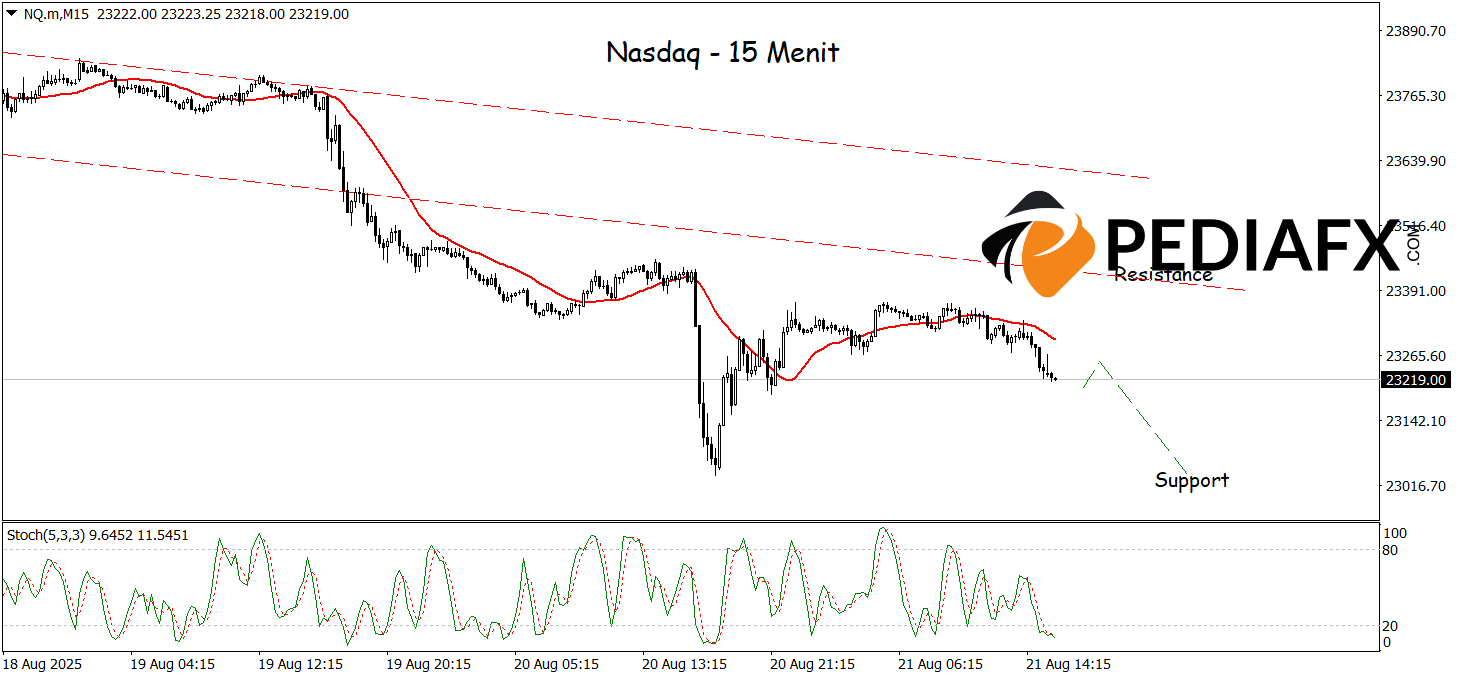
On the 15-minute timeframe, the Nasdaq further confirms the sellers’ dominance after price action breached the bearish channel and established a new low. This movement reinforces the signal that selling pressure continues to dominate the market. Meanwhile, the stochastic indicator, which has turned down from the overbought zone, confirms the potential for further declines. Supported by these technical factors, the Nasdaq may continue its downward trend to test a crucial support level near 23,042.
Technical Reference: sell as long as below 23,404
Potential Stop Loss 1: 23,343
Potential Stop Loss 2: 23,404
Potential Take Profit 1: 23,110
Potential Take Profit 2: 23,042


