

The USDJPY currency pair is exhibiting signs of continued weakness as prices approach the lower boundary of the Bollinger Bands. This pattern signals increased selling pressure, particularly when the price breaks below a crucial support level in this range.
Additionally, technical indicators like the MACD (Moving Average Convergence Divergence) reinforce the bearish signal, with the MACD line positioned below the signal line, indicating the dominance of sellers. The convergence of these two indicators suggests that the downward trend in USDJPY is likely to persist towards the next support level, prompting traders to be vigilant about the potential for deeper declines.
Recommended

Recommended

Recommended

Recommended
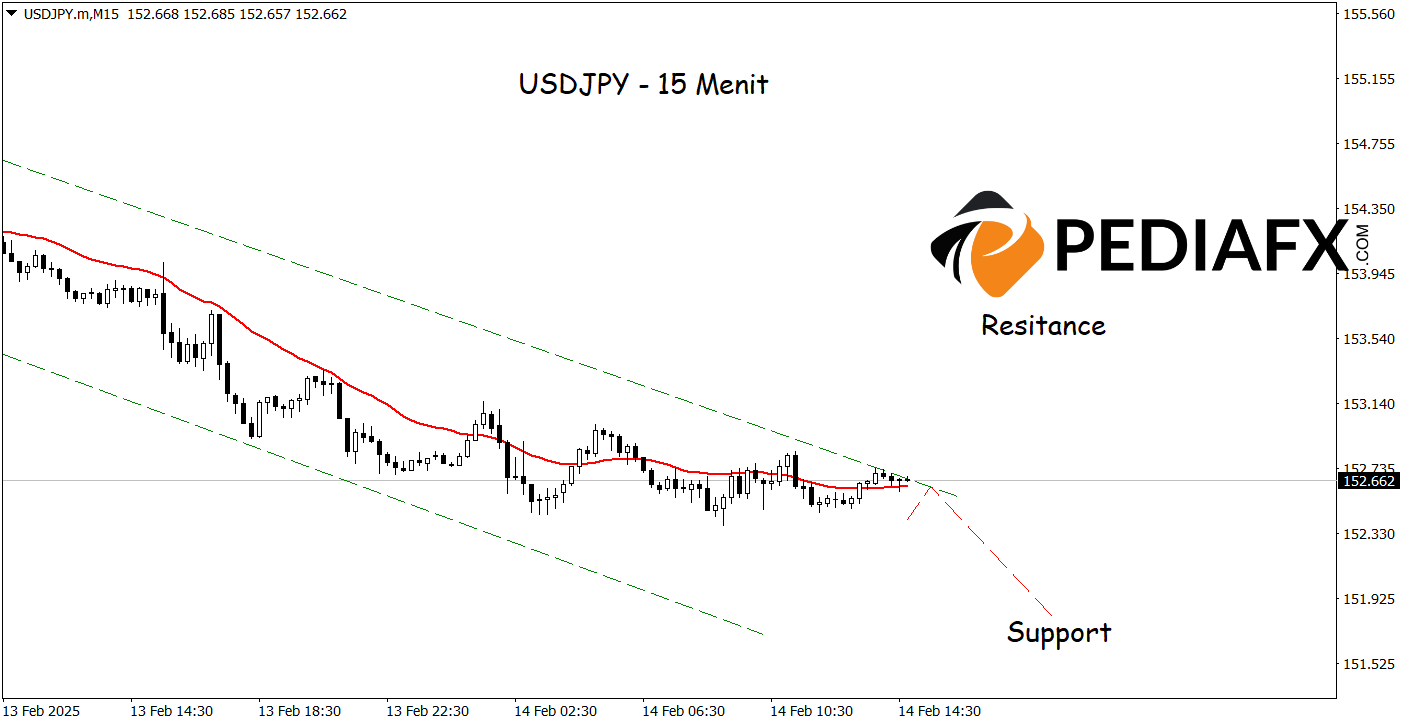
USDJPY remains under pressure as prices consistently trade within a bearish channel, indicating a strong downward trend. The Moving Average (MA) indicator further corroborates this signal, as prices stay beneath the MA line, reflecting persistent selling pressure. This technical pattern indicates that sellers are still in control, opening up opportunities for USDJPY to continue its decline toward the support level of 151,800.
Technical Reference: Sell while below 153,520
Potential Stop Loss 1: 153,200
Potential Stop Loss 2: 153,520
Potential Take Profit 1: 152,055
Potential Take Profit 2: 151,800


