

The USDJPY currency pair is exhibiting further signs of weakness as the price approaches the lower boundary of the Bollinger Bands. This pattern suggests a growing selling pressure, particularly when the price breaches a significant support level in this region.
Other technical indicators, such as the MACD (Moving Average Convergence Divergence), further reinforce the bearish signal, with the MACD line positioned below the signal line, indicating a seller dominance. The combination of these two indicators presents a substantial opportunity for the USDJPY’s downtrend to continue towards the next support level, leading traders to exercise caution regarding the possibility of a deeper decline.
Recommended

Recommended

Recommended

Recommended
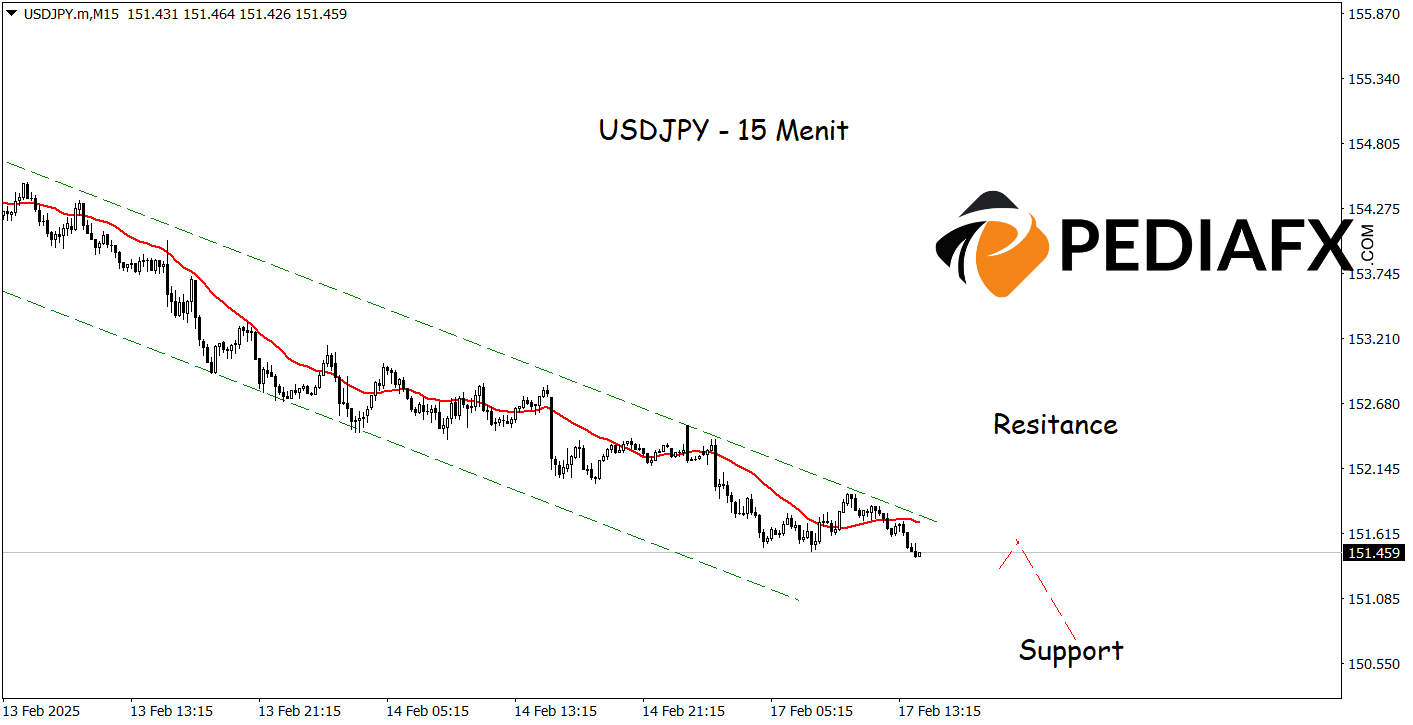
The USDJPY remains under significant pressure as the price consistently operates within a bearish channel, signaling a strong downward trend. The Moving Average (MA) indicator also substantiates this trend, with the price consistently staying below the MA line, reflecting a predominance of selling pressure. This technical setup indicates that sellers are still in control, opening possibilities for the USDJPY to continue its descent towards a support level of 150.760.
Technical Reference: sell while below 152.345
Potential Stop Loss 1: 152.060
Potential Stop Loss 2: 152.345
Potential Take Profit 1: 151.070
Potential Take Profit 2: 150.760


